

Meeting the Moment: Mobilizing CPAs to Address Canada’s Economic Challenge
March 6, 2025
Executive Summary
It has been a dramatic wake-up call.
Sweeping U.S. tariffs, along with the potential resulting recession and loss of up to 600,000 Canadian jobs, pose an existential threat to Canada’s prosperity. The Canadian public has been galvanized in its response, and action is being taken to build a stronger Canada—one that can weather future storms and enhance economic resilience.
While President Trump’s tariffs may have been the catalyst, Canada’s economic stagnation was already well underway before his return to the White House. The alarm bells have been sounding for years; complacency has allowed these challenges to grow into a full-blown crisis:
- Stagnant living standards: Canadian real GDP per capita has shown virtually no improvement in seven years and is projected to fall to just 70% of U.S. levels by 2029.
- Lagging Productivity: Canada’s productivity is only 72% of U.S. levels and continuing to decline.
- Misaligned investment: Canada leads OECD countries in housing-related investment but ranks low in productivity-enhancing business investment.
- Declining business investment per worker: Investment per Canadian worker has fallen to less than 50% of U.S. level.
Tariffs, compounded by the Trump administration’s commitment to corporate tax cuts and deregulation, will only exacerbate these challenges by reducing demand for Canadian goods and making the U.S. more attractive for investment.
There is nothing like an external threat to spark action, and Canadian consensus is developing around the necessity of transformational change. There has been a rising call to action across the country, and in response, leaders and experts from every sector of the economy are assembling their blueprints for Canada’s future.
The Chartered Professional Accountant (CPA) profession is among those answering the call. In their role as trusted advisors and technical experts, CPAs are at the centre of the economy and supporting Canadian businesses as they prepare for the impact of tariffs on taxes and supply chains.
This CPA Ontario report lays the foundation by putting the challenge the country faces in sharp focus. Through the Trade and Growth Insights initiative, CPA Ontario will be engaging the top minds in the profession to help shape an economy that not only weathers the storms of today, but delivers growth, opportunity, and prosperity tomorrow.
Introduction
The numbers speak for themselves.
The Economic Policy Uncertainty Index shows that Canadian policy uncertainty is at its highest recorded level, orders of magnitude higher than any other shock over the past 40 years including the COVID-19 pandemic, NAFTA renegotiations, the 2008-09 global financial crisis, the 9/11 attack on the U.S., and the major Canadian recession of the early 1990s (see Figure 1). Sweeping U.S. tariffs could reduce Canada’s GDP by 2.6%, cost the country up to 600,000 jobs, and push the unemployment rate to nearly 10%. In Ontario, approximately 13% of jobs are at risk due to U.S. tariffs, and 14.5% of the province’s income comes from exports to the U.S. This isn’t just another economic challenge; it’s an existential threat to Canadian prosperity.
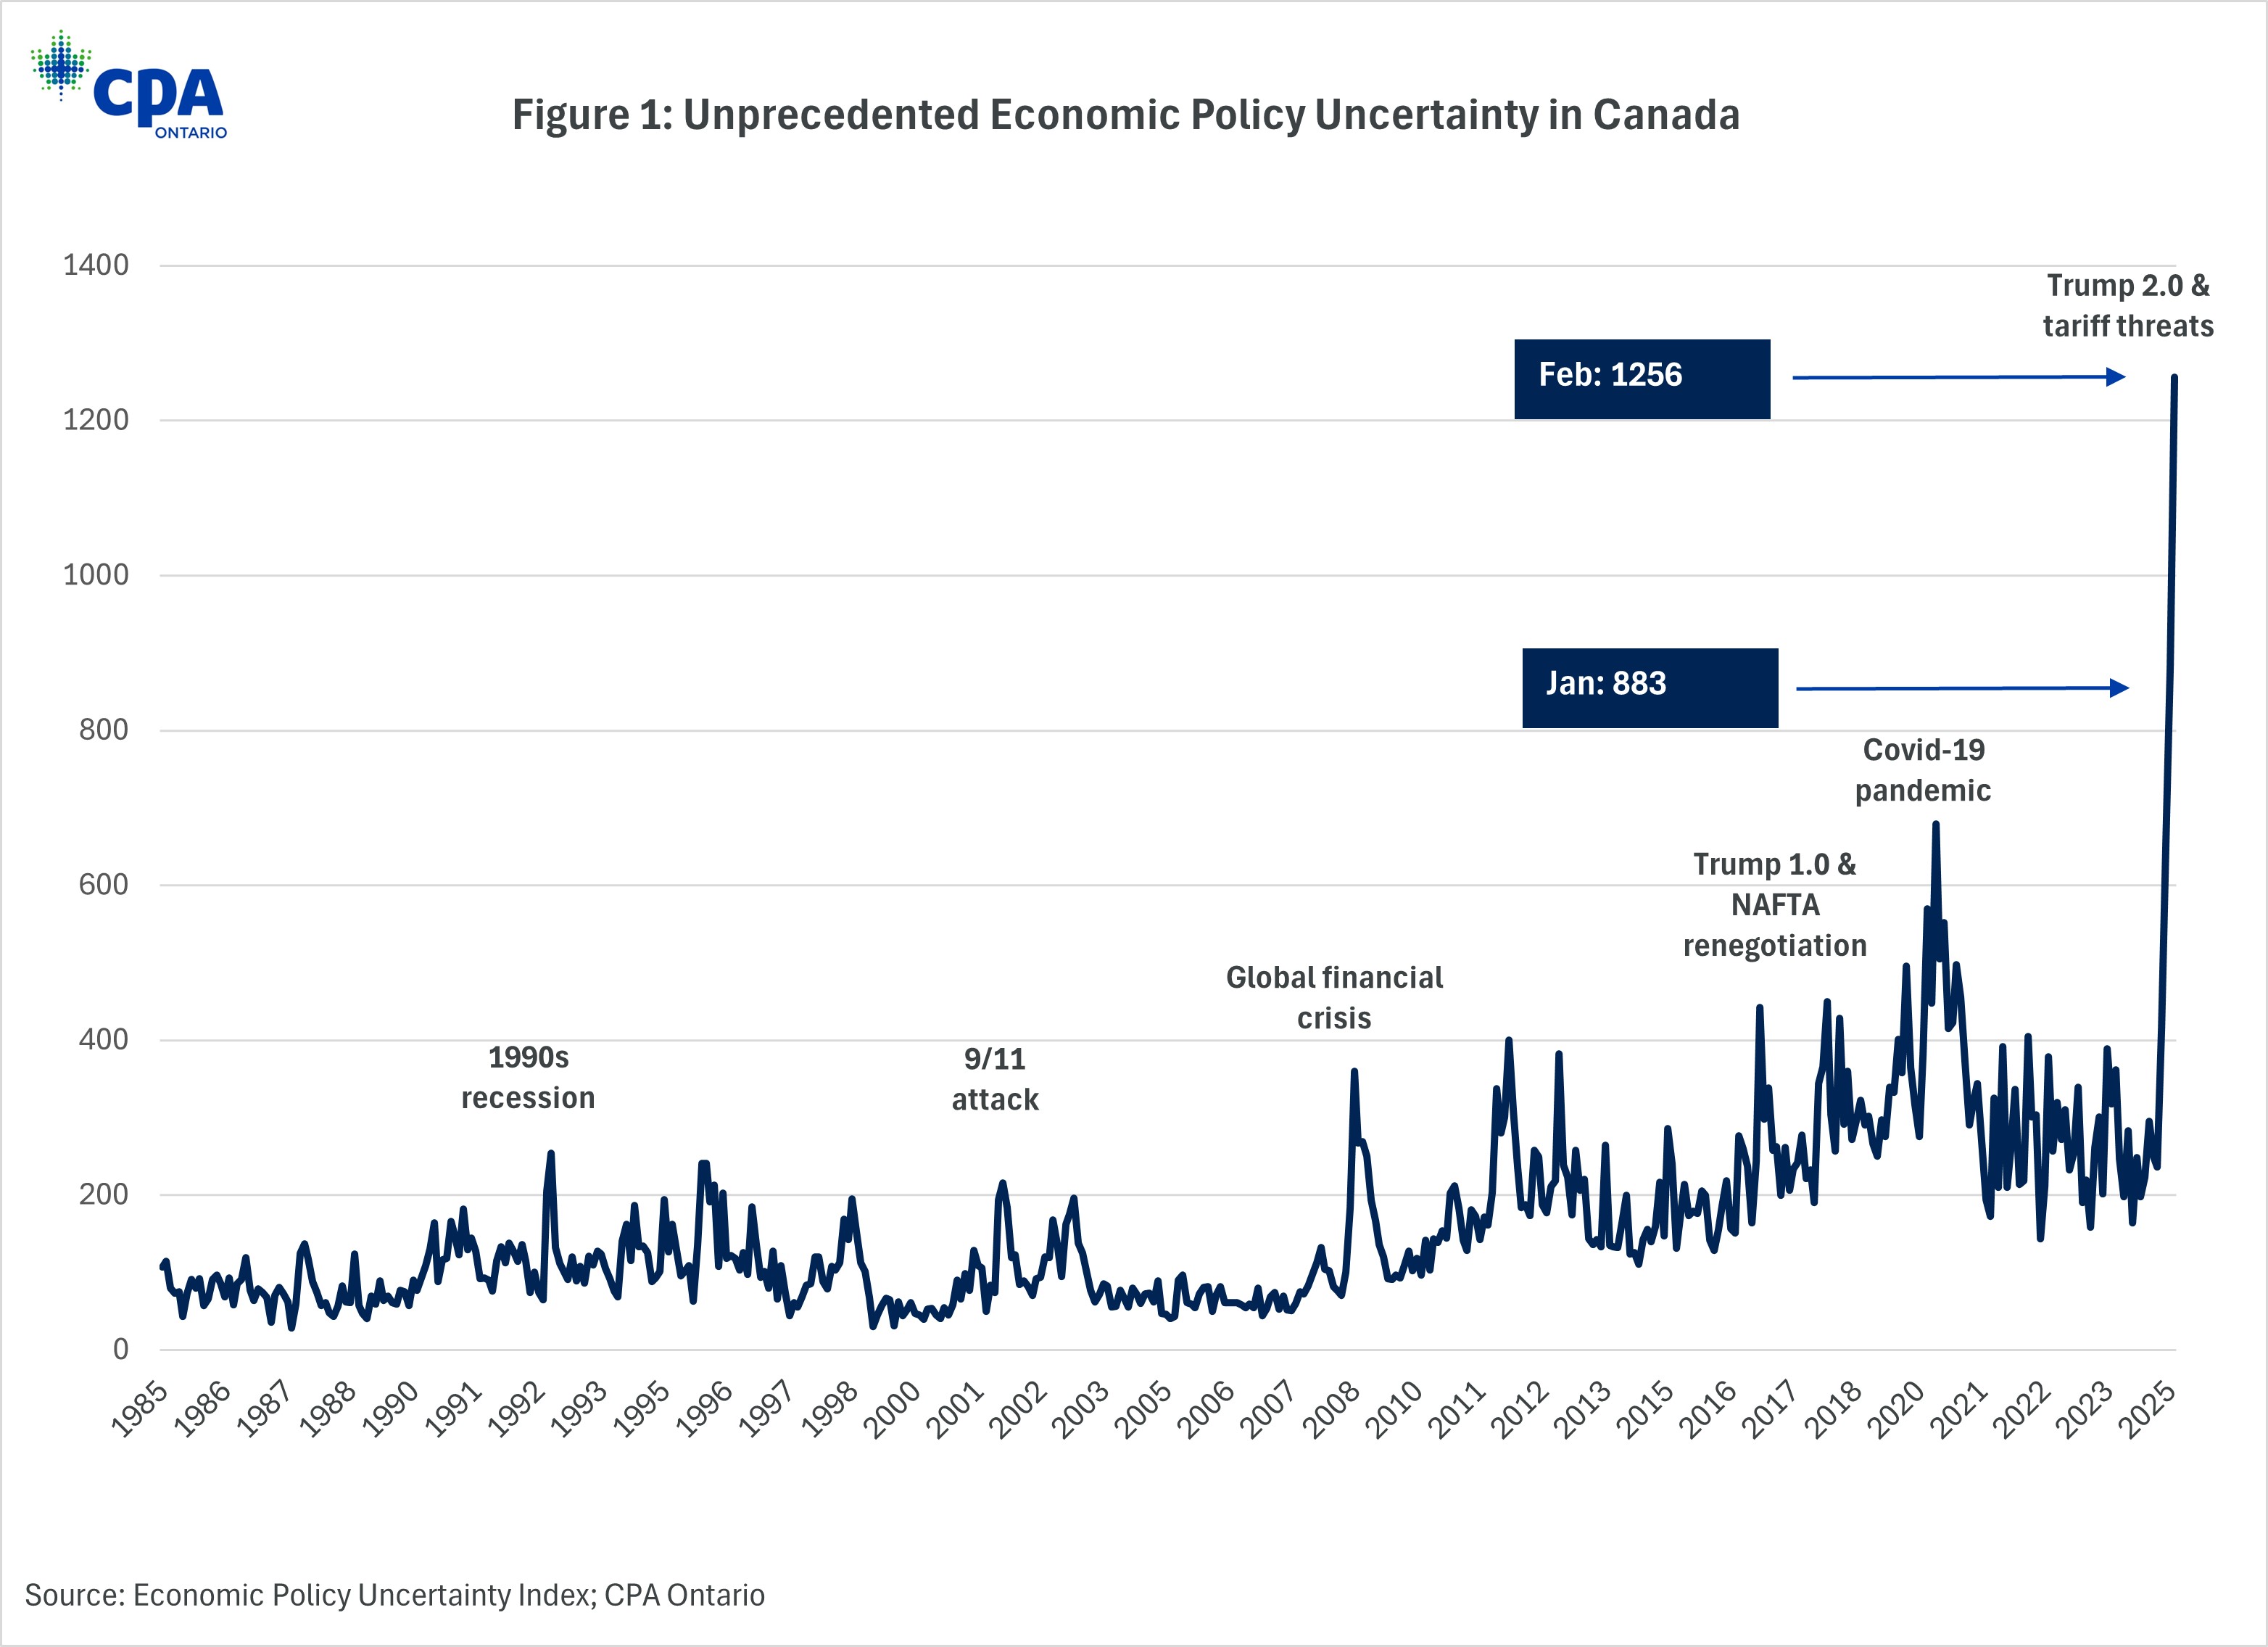
Figure 1: Unprecedented Economic Policy Uncertainty in Canada
Uncertainty isn’t a theoretical abstraction; it functions as an “invisible tax” by discouraging investment, innovation, entrepreneurship, and economic growth.[1] Businesses hesitate to expand, new ventures are paused, and capital flows elsewhere.
This period of intense uncertainty is colliding with a Canadian economy that, for some time now, has been plagued with deep-rooted challenges, such as a longstanding productivity crisis. These structural weaknesses have left Canada dangerously exposed to external shocks. Enter President Trump’s trade war.
This is not the time for half measures. Another industrial tax credit or minor policy adjustment won’t cut it. Canada needs bold, audacious policy transformation. It needs signature policies that will act as a calling card for the country as one of the best places in the world to work, invest, innovate, and start a business. Canada must establish a clear reason why businesses should invest capital, start ventures, and grow businesses here rather than elsewhere.
While we can’t control what the U.S. administration does, we can take the necessary steps to overhaul our own public policy landscape. This moment demands that we examine everything—from regulatory frameworks to interprovincial trade barriers, to the complexity and inefficiency of the tax code. Nothing should be off the table. We need out-of-the-box thinking that challenges the status quo and reimagines Canada’s economic policy approach.
To meet this moment, CPA Ontario is mobilizing the profession’s best minds. Leading CPAs from across the province are stepping forward, bringing their decades of financial expertise and strategic insight to the challenge. According to a recent survey of CPAs conducted by CPA Ontario, 85% of respondents believe it is important for the profession to inform and influence public policies. And it makes sense why; as trusted advisors across every sector of the economy, CPAs have a unique role to play in charting a way forward.
This report marks the launch of a comprehensive initiative bringing together the profession’s best to develop bold policy recommendations and practical strategies. By gathering the best perspectives from across the profession, we aim to provide the strategic guidance that Canada needs to meet this moment. Across the country, policymakers, business leaders, and ordinary Canadians are already stepping up. There is a groundswell of energy that we cannot let go to waste. Together we can seize this moment, forge a stronger, more resilient economy, and emerge from this storm a more prosperous country.
Before we can chart a path forward and suggest solutions, we must understand exactly where we stand, including the depth and breadth of the challenge. The following analysis presents the sobering reality of Canada’s current economic standing.
The Economic Challenges Facing Canada and Ontario
Canada’s economic performance has been losing ground relative to the U.S. and many G7 peers for the past several years.[2] While Canada continues to enjoy a relatively high standard of living overall, the signs of economic underperformance—from sluggish growth in real GDP per capita to persistently weak productivity and declining rates of business investment—warrant close attention. Ontario, representing 38.2% of Canada’s economy, has also struggled to meet its full economic potential, with profound implications for the country as a whole.
The following outlines Canada’s and Ontario’s current economic challenges, focusing on three interrelated indicators: real GDP per capita, productivity, and business investment.
Real GDP per Capita in Decline
Real GDP per capita is a crucial measure of living standards because it reflects the average income and economic well-being of individuals within a jurisdiction, adjusting for changes in prices. Rising real GDP per capita generally indicates improvements in living conditions, as it suggests higher productivity, better wages, and greater access to goods and services. Higher levels are often linked to better healthcare, education, infrastructure, and overall quality of life.
Canadian living standards are stuck in a rut. After adjusting for inflation, Canada’s GDP per capita in the third quarter of 2024 ($58,601) is at roughly the same level as 2017, meaning there has been virtually no improvement in average living standards over the last seven years (see Figure 2). In fact, average living standards have declined in eight of the last 10 quarters.
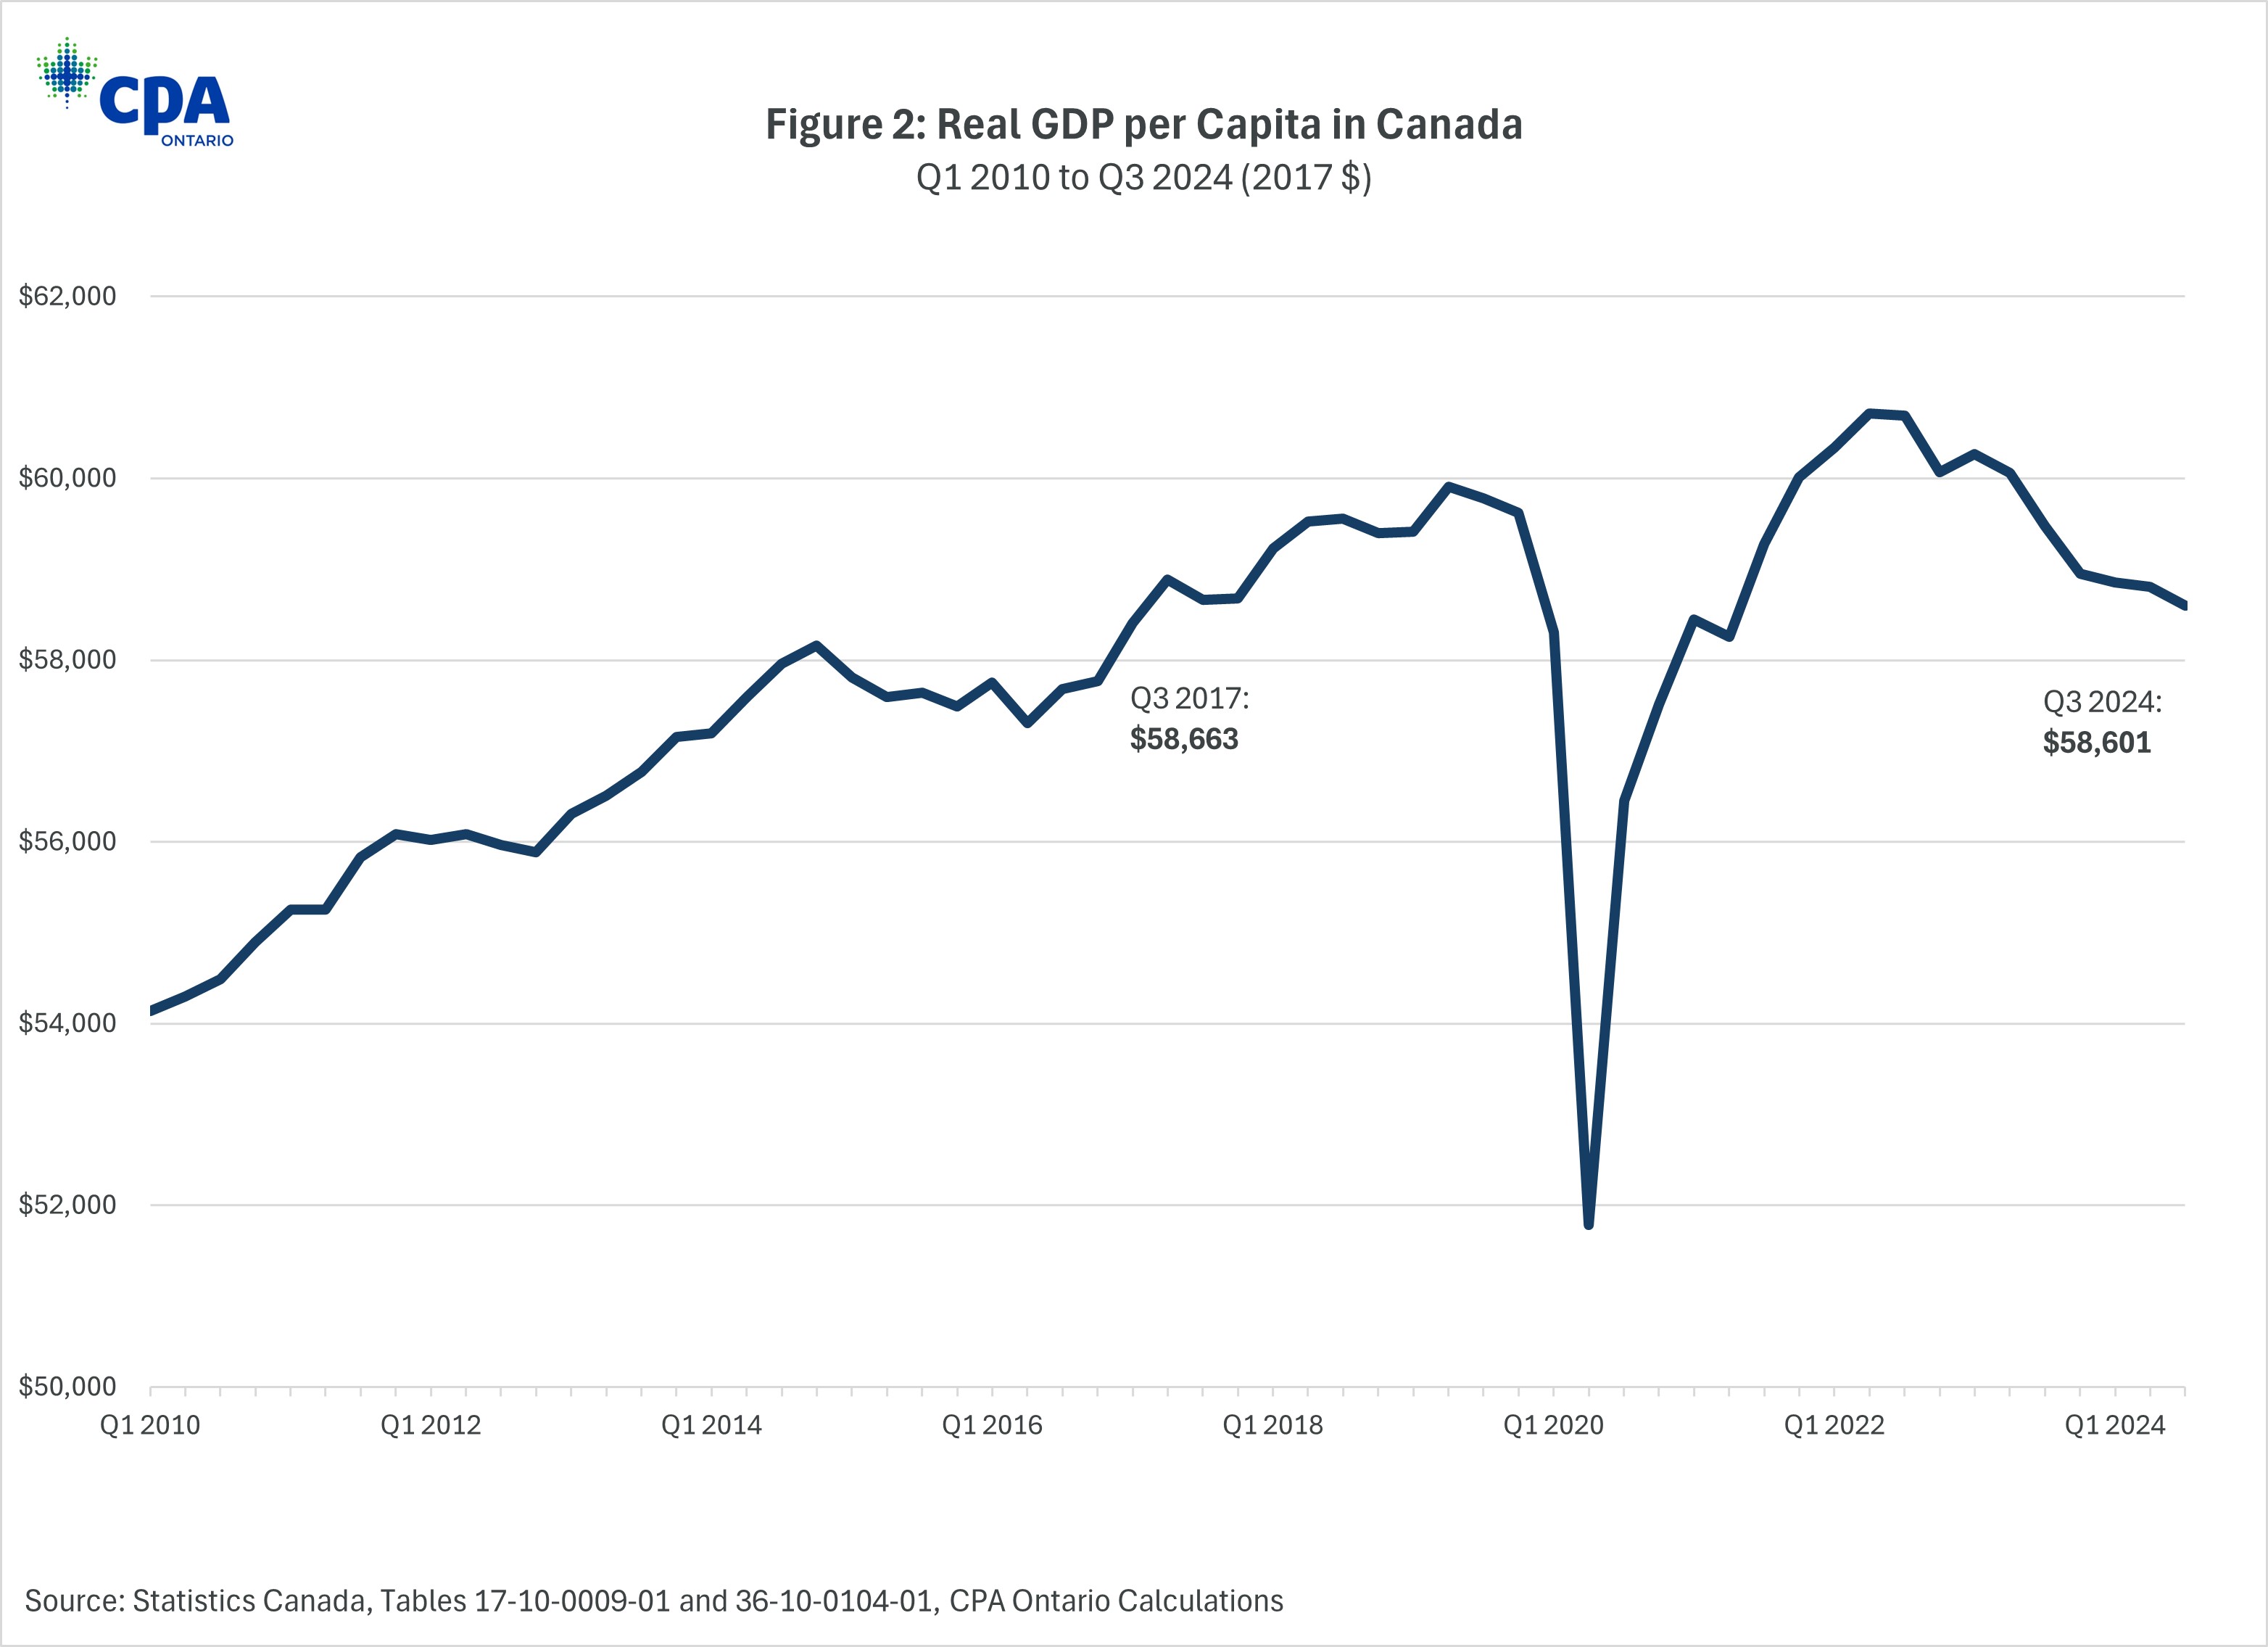
Figure 2: Real GDP per Capita in Canada
Internationally, as Figure 3 shows, Canada’s real GDP per capita is in the middle of the pack relative to other advanced nations belonging to the Organisation for Economic Co-operation and Development (OECD).
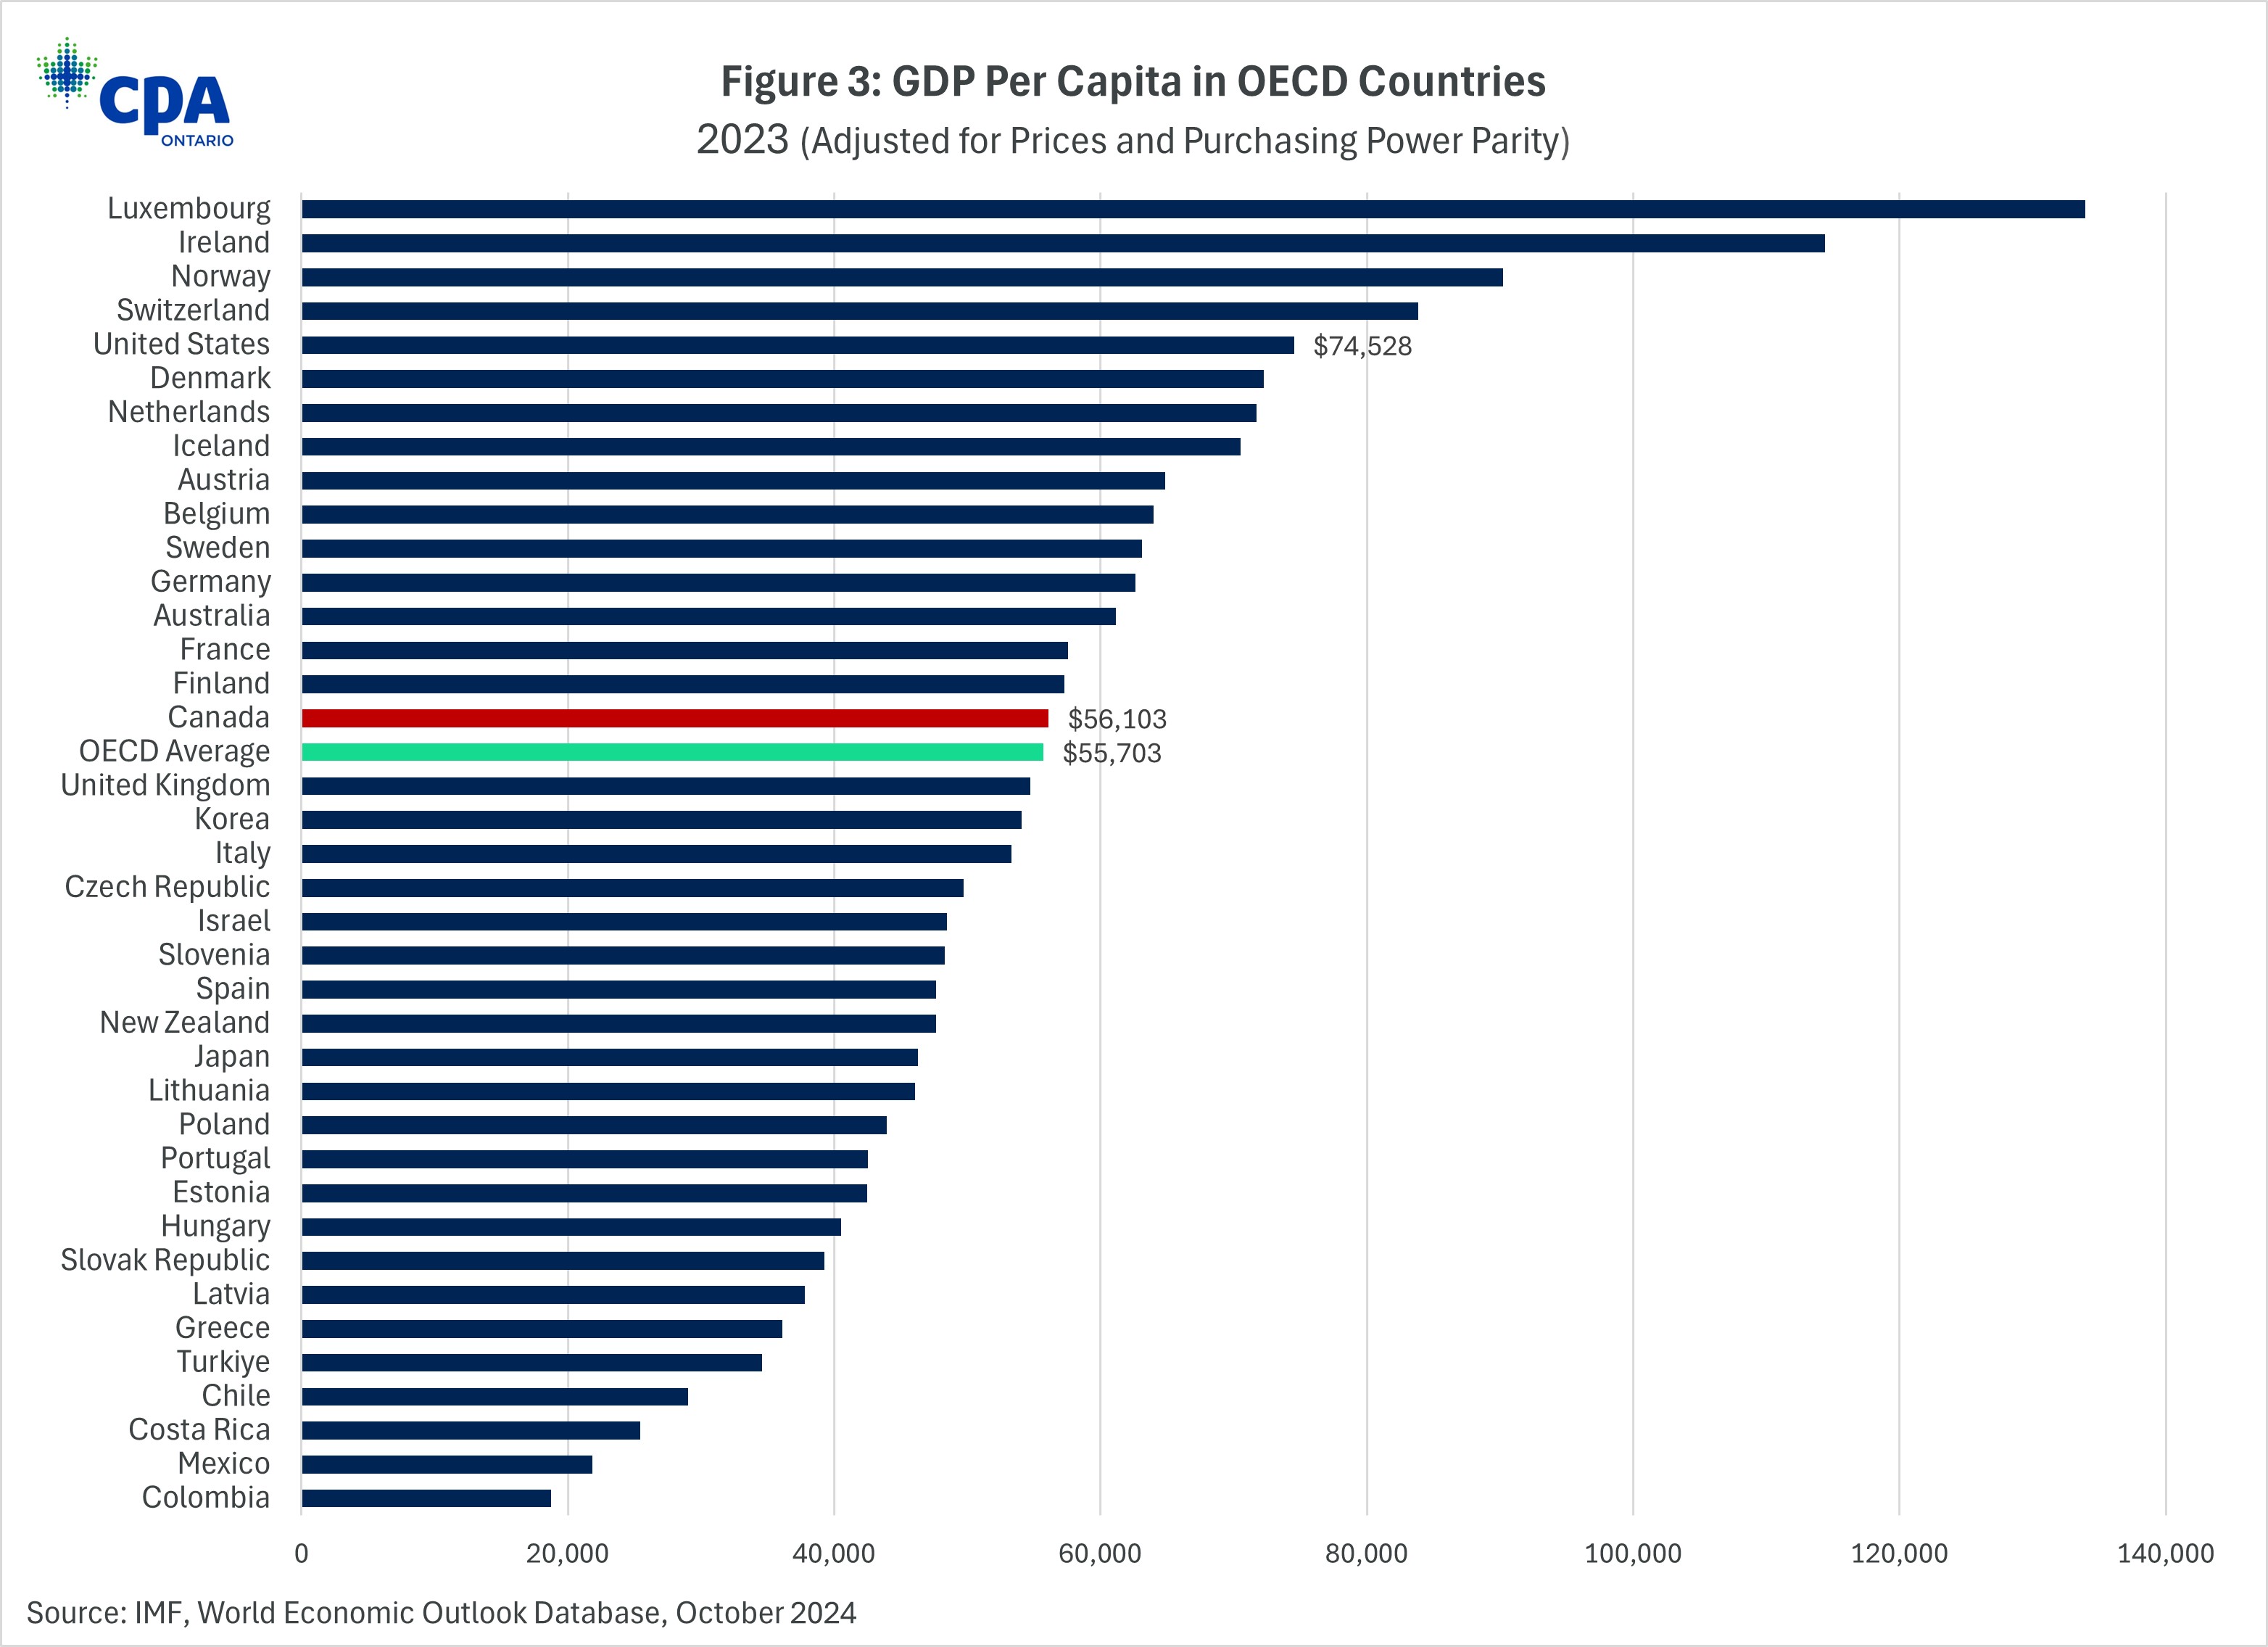
Figure 3: GDP Per Capita in OECD Countries
Among OECD nations, Canada is one of just seven countries that experienced a decline in real GDP per capita from 2019 to 2023, spanning from the year before the pandemic to the most recent available data (see Figure 4). During this timeframe, average living standards declined by 1.24%. Within the G7, Germany was the only other nation to see a drop in living standards. This stands in stark contrast to the U.S., which saw growth in real GDP per capita of 7.29% over the same period.
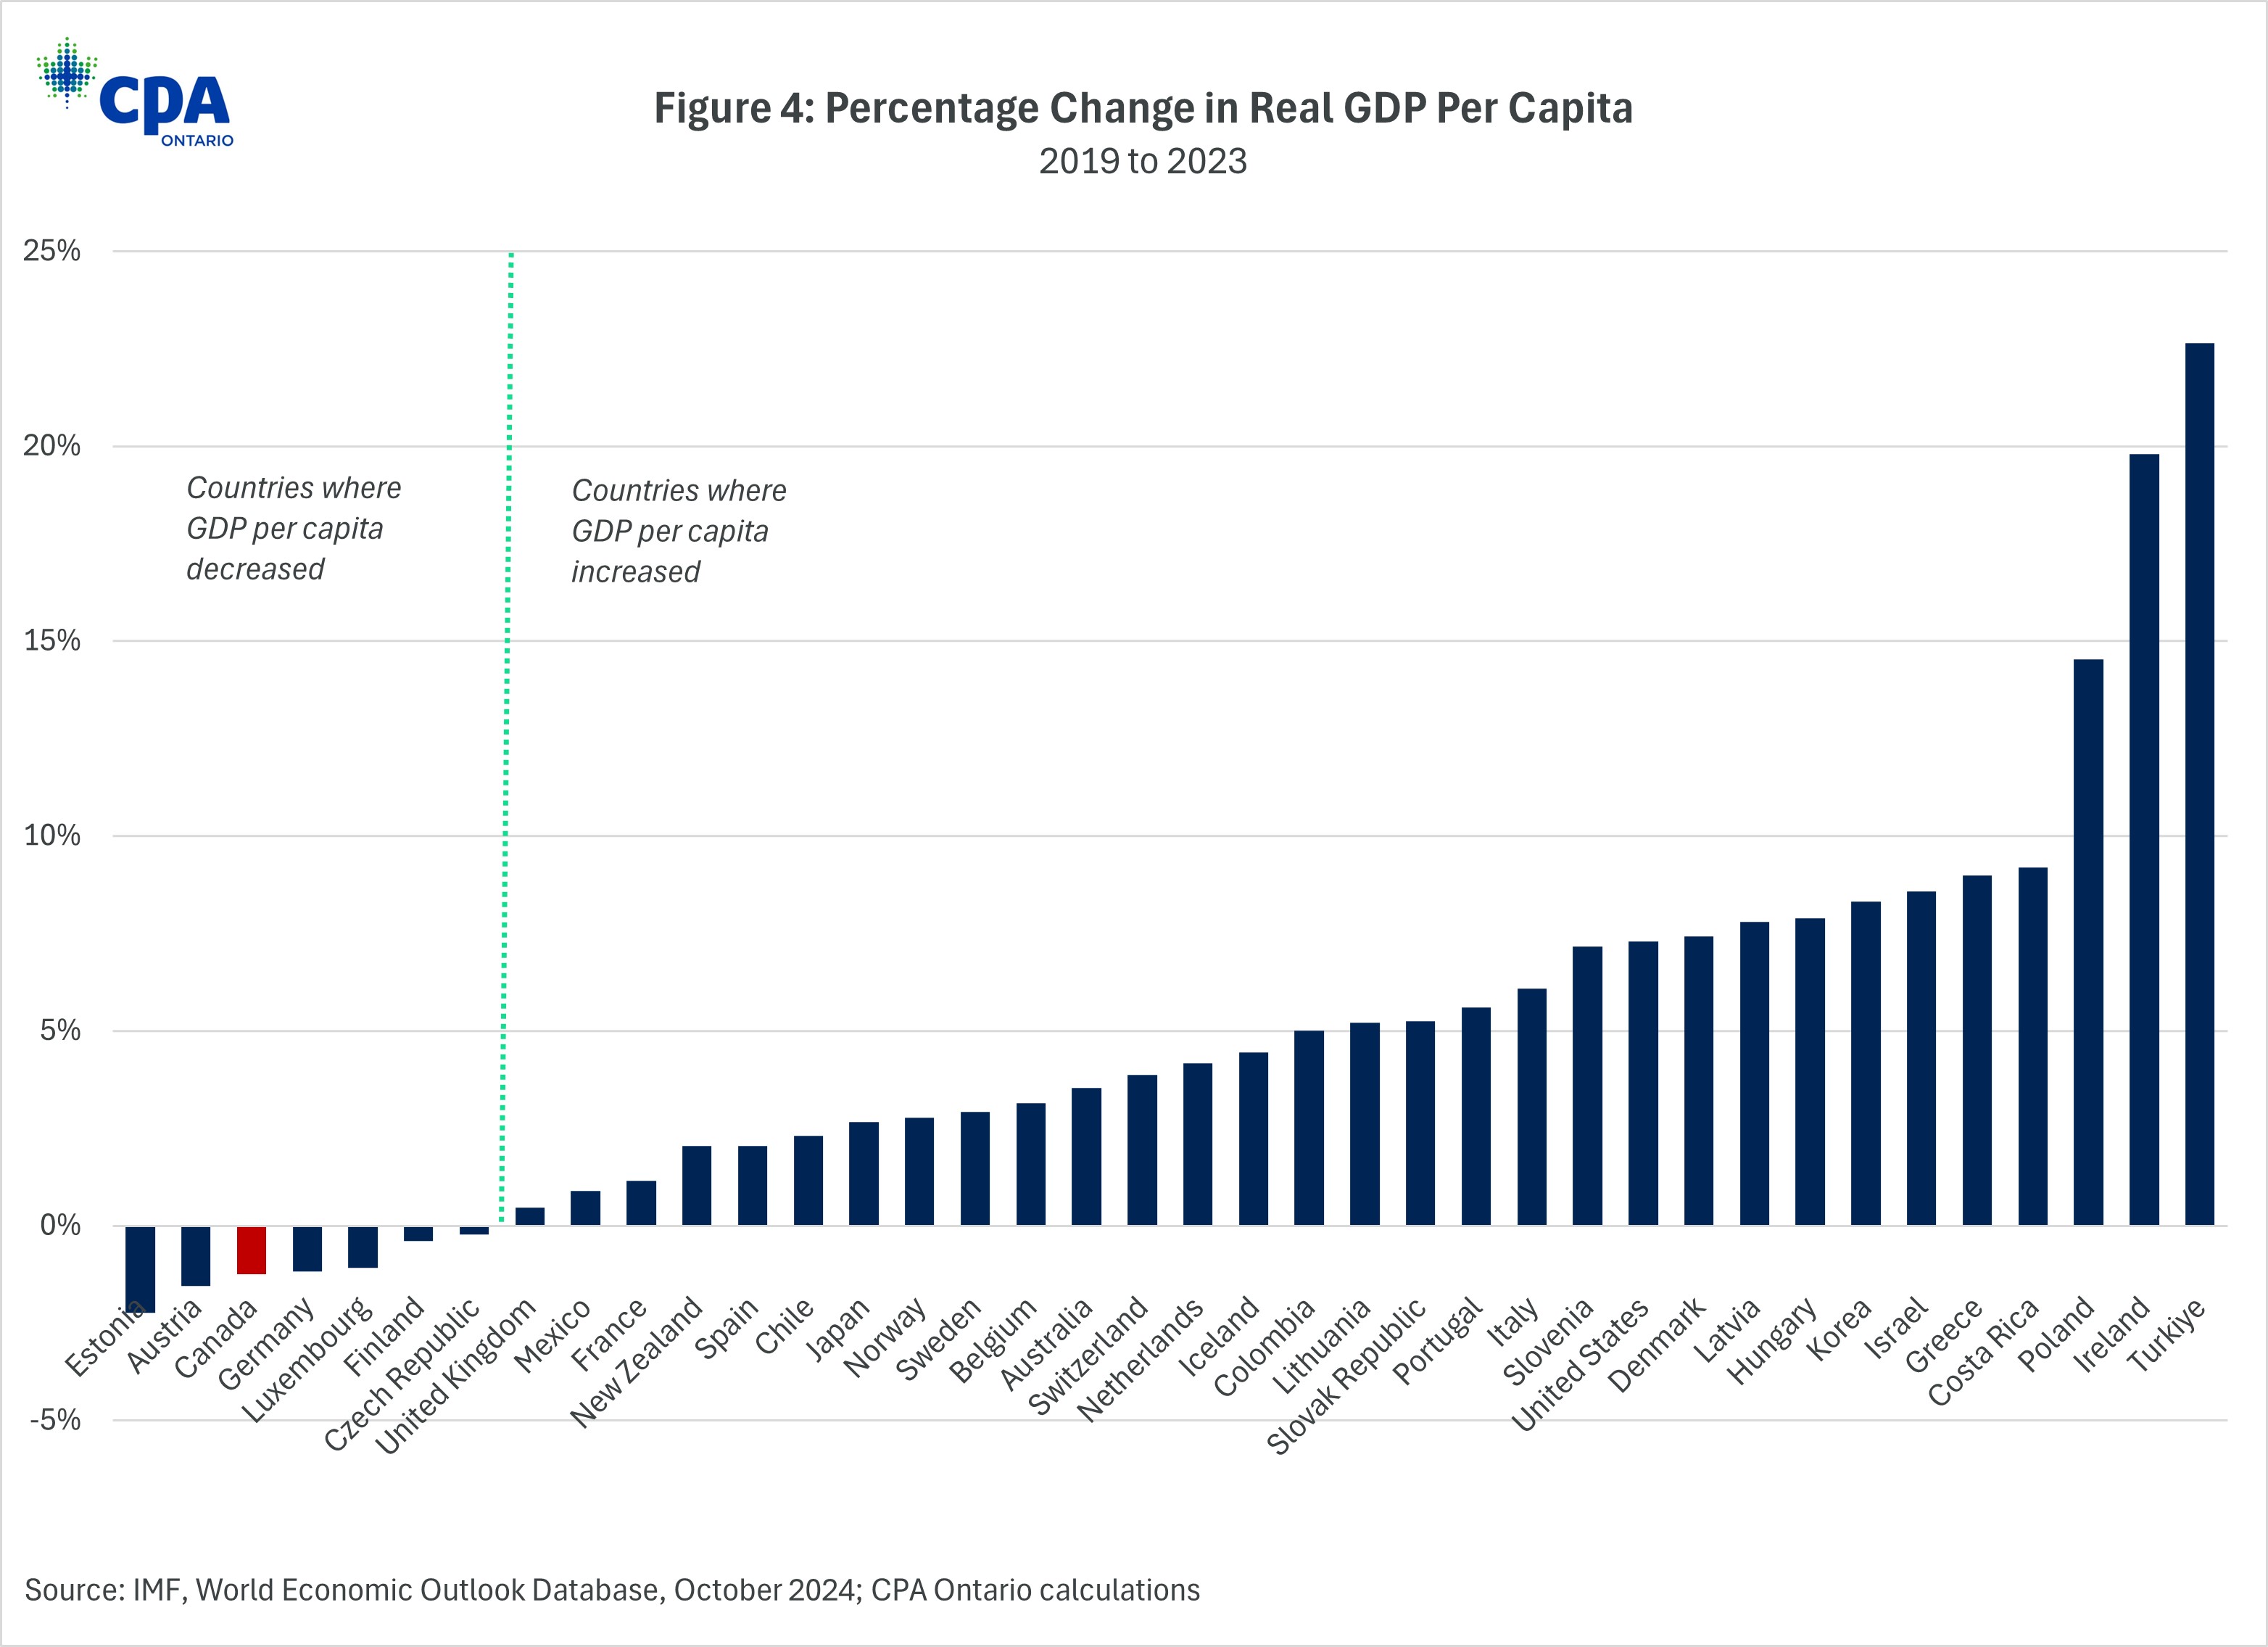
Figure 4: Percentage Change in Real GDP Per Capita
The contrast between the trajectory of Canadian and American living standards is striking, as seen in Figures 5a and 5b, with Canada continuing to fall behind. In 2010, Canadian real GDP per capita was 87% of the U.S. before shrinking to 75% by 2023. Based on International Monetary Fund (IMF) projections in the October 2024 edition of the World Economic Outlook, average Canadian living standards will be only 70% of that south of the border by the end of the decade (see Figure 5b). In dollar terms, the 2010 inflation and exchange rate adjusted living standards gap between the two countries was about $7,900, but by 2023, it grew to nearly $18,500. In 2029, this gap is projected to rise further to almost $25,000.
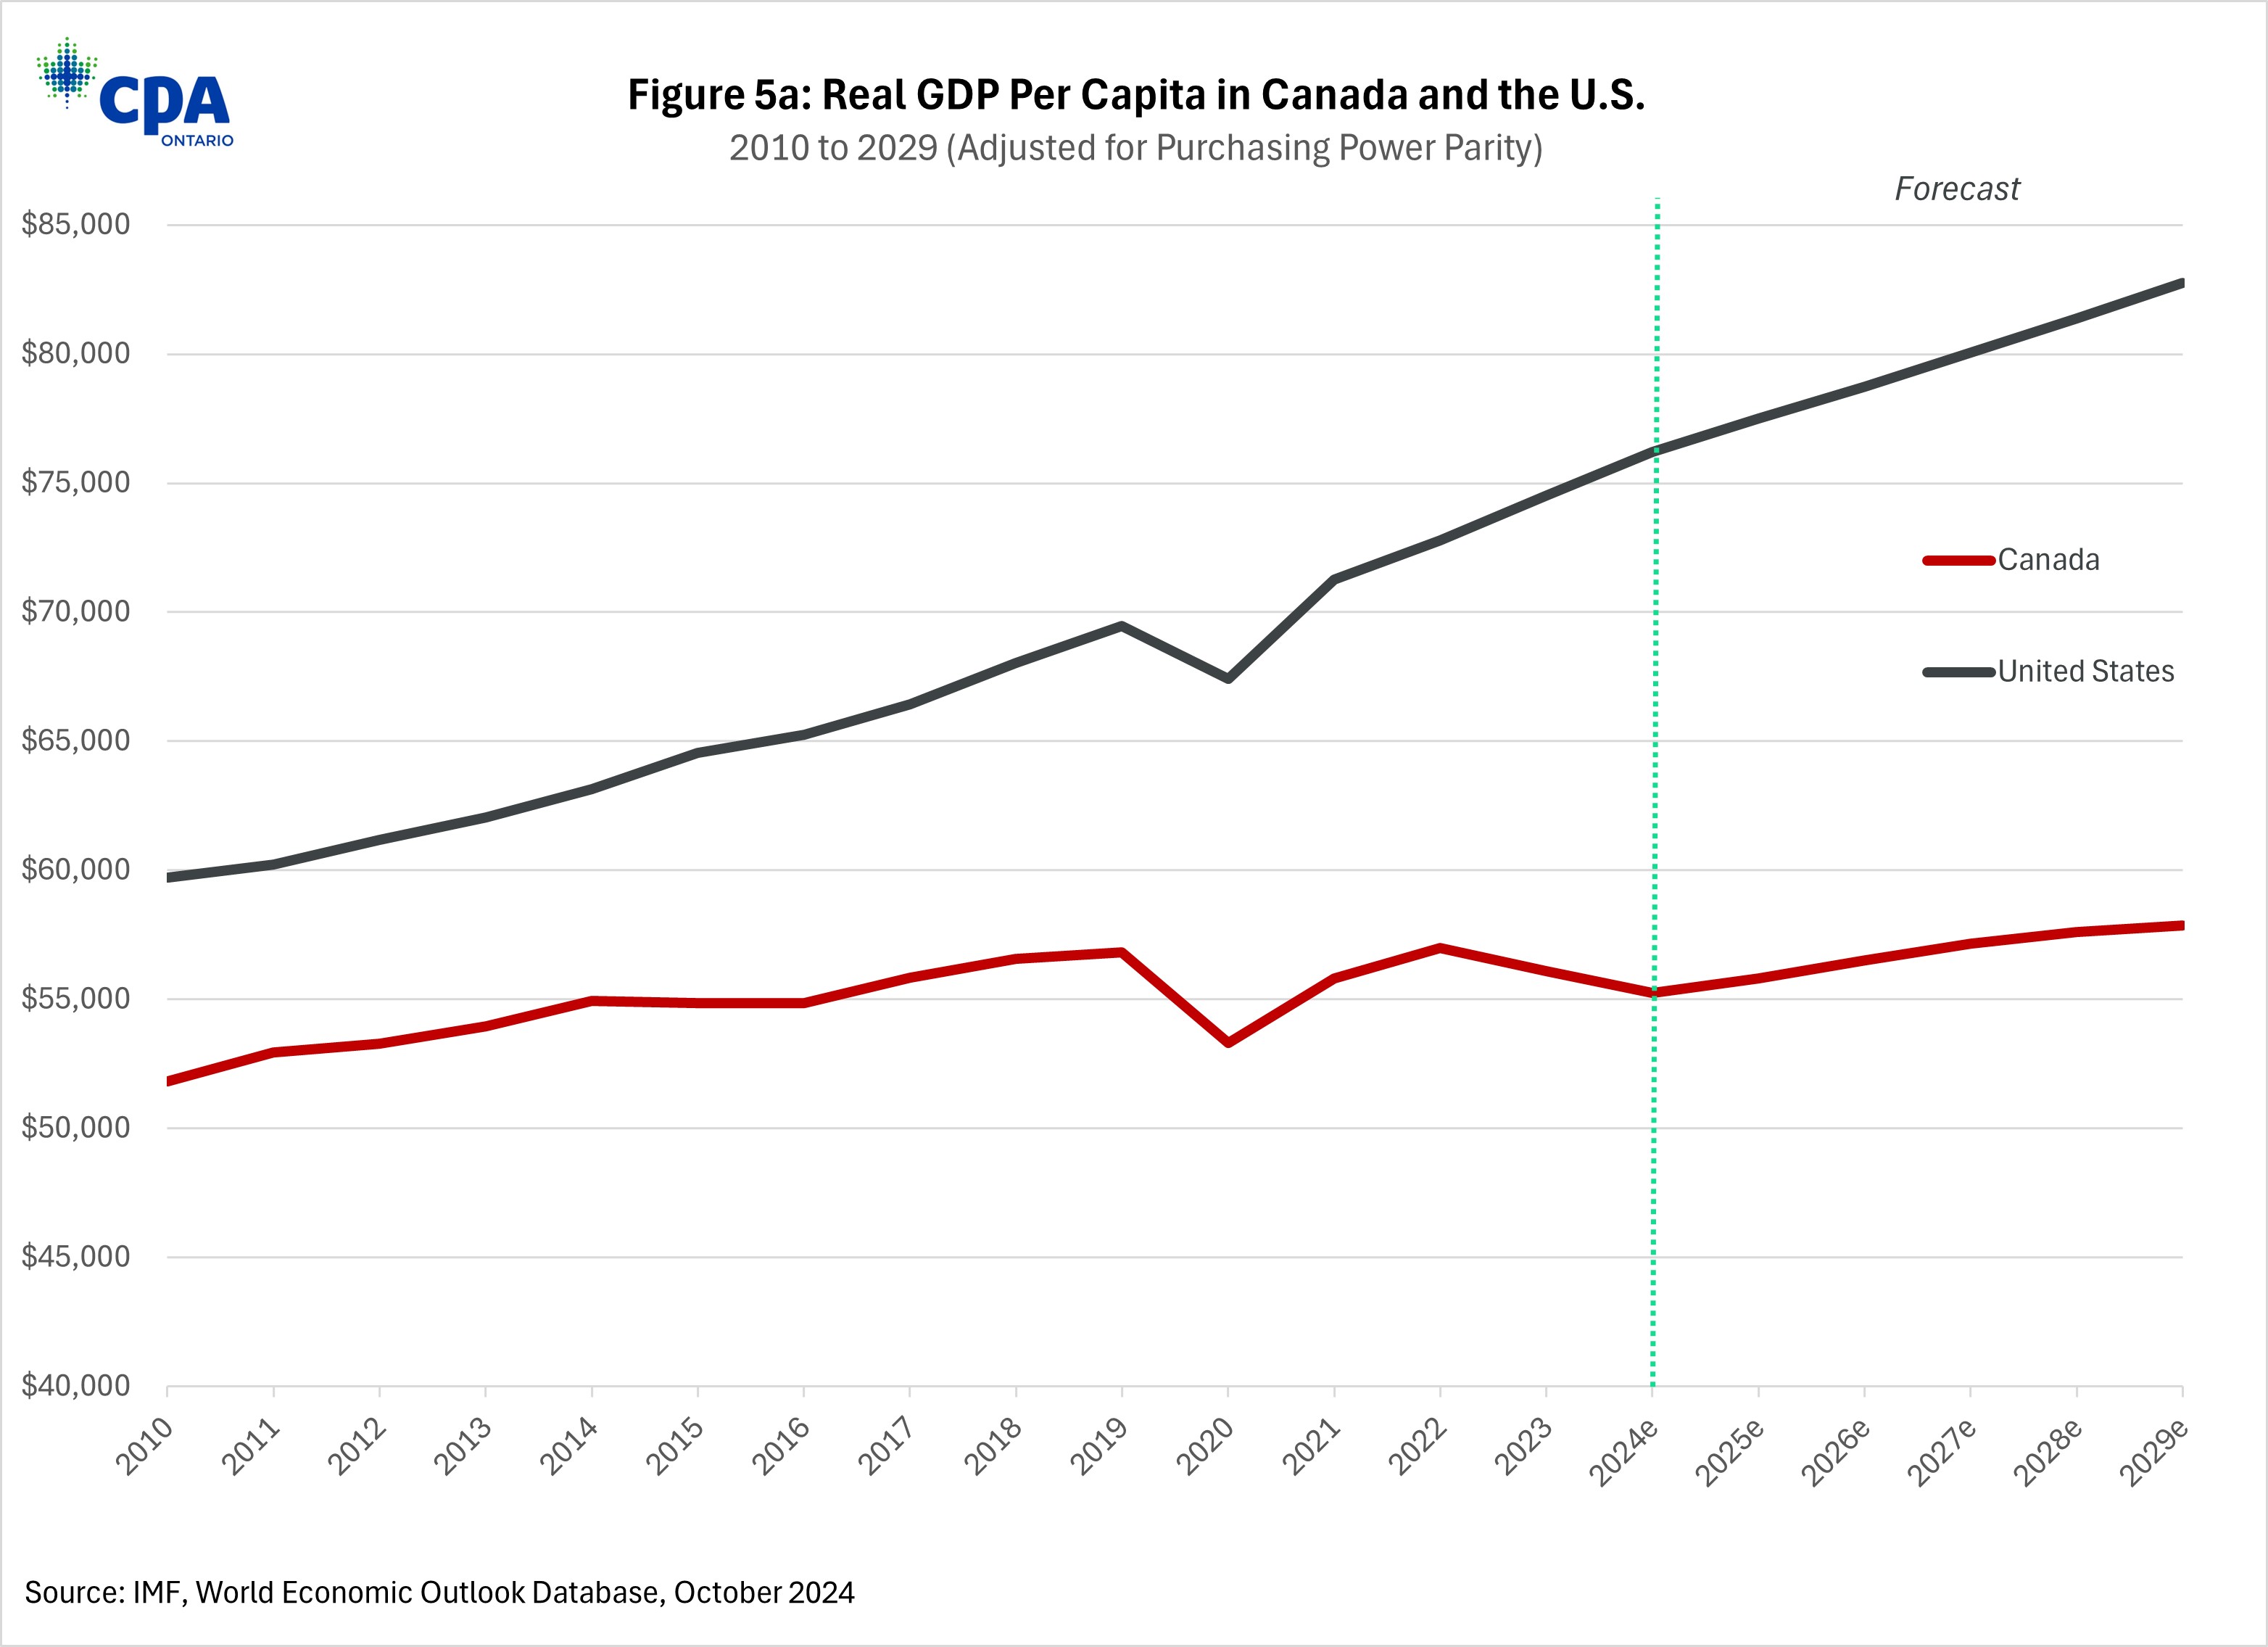
Figure 5a: Real GDP Per Capita in Canada and the U.S.
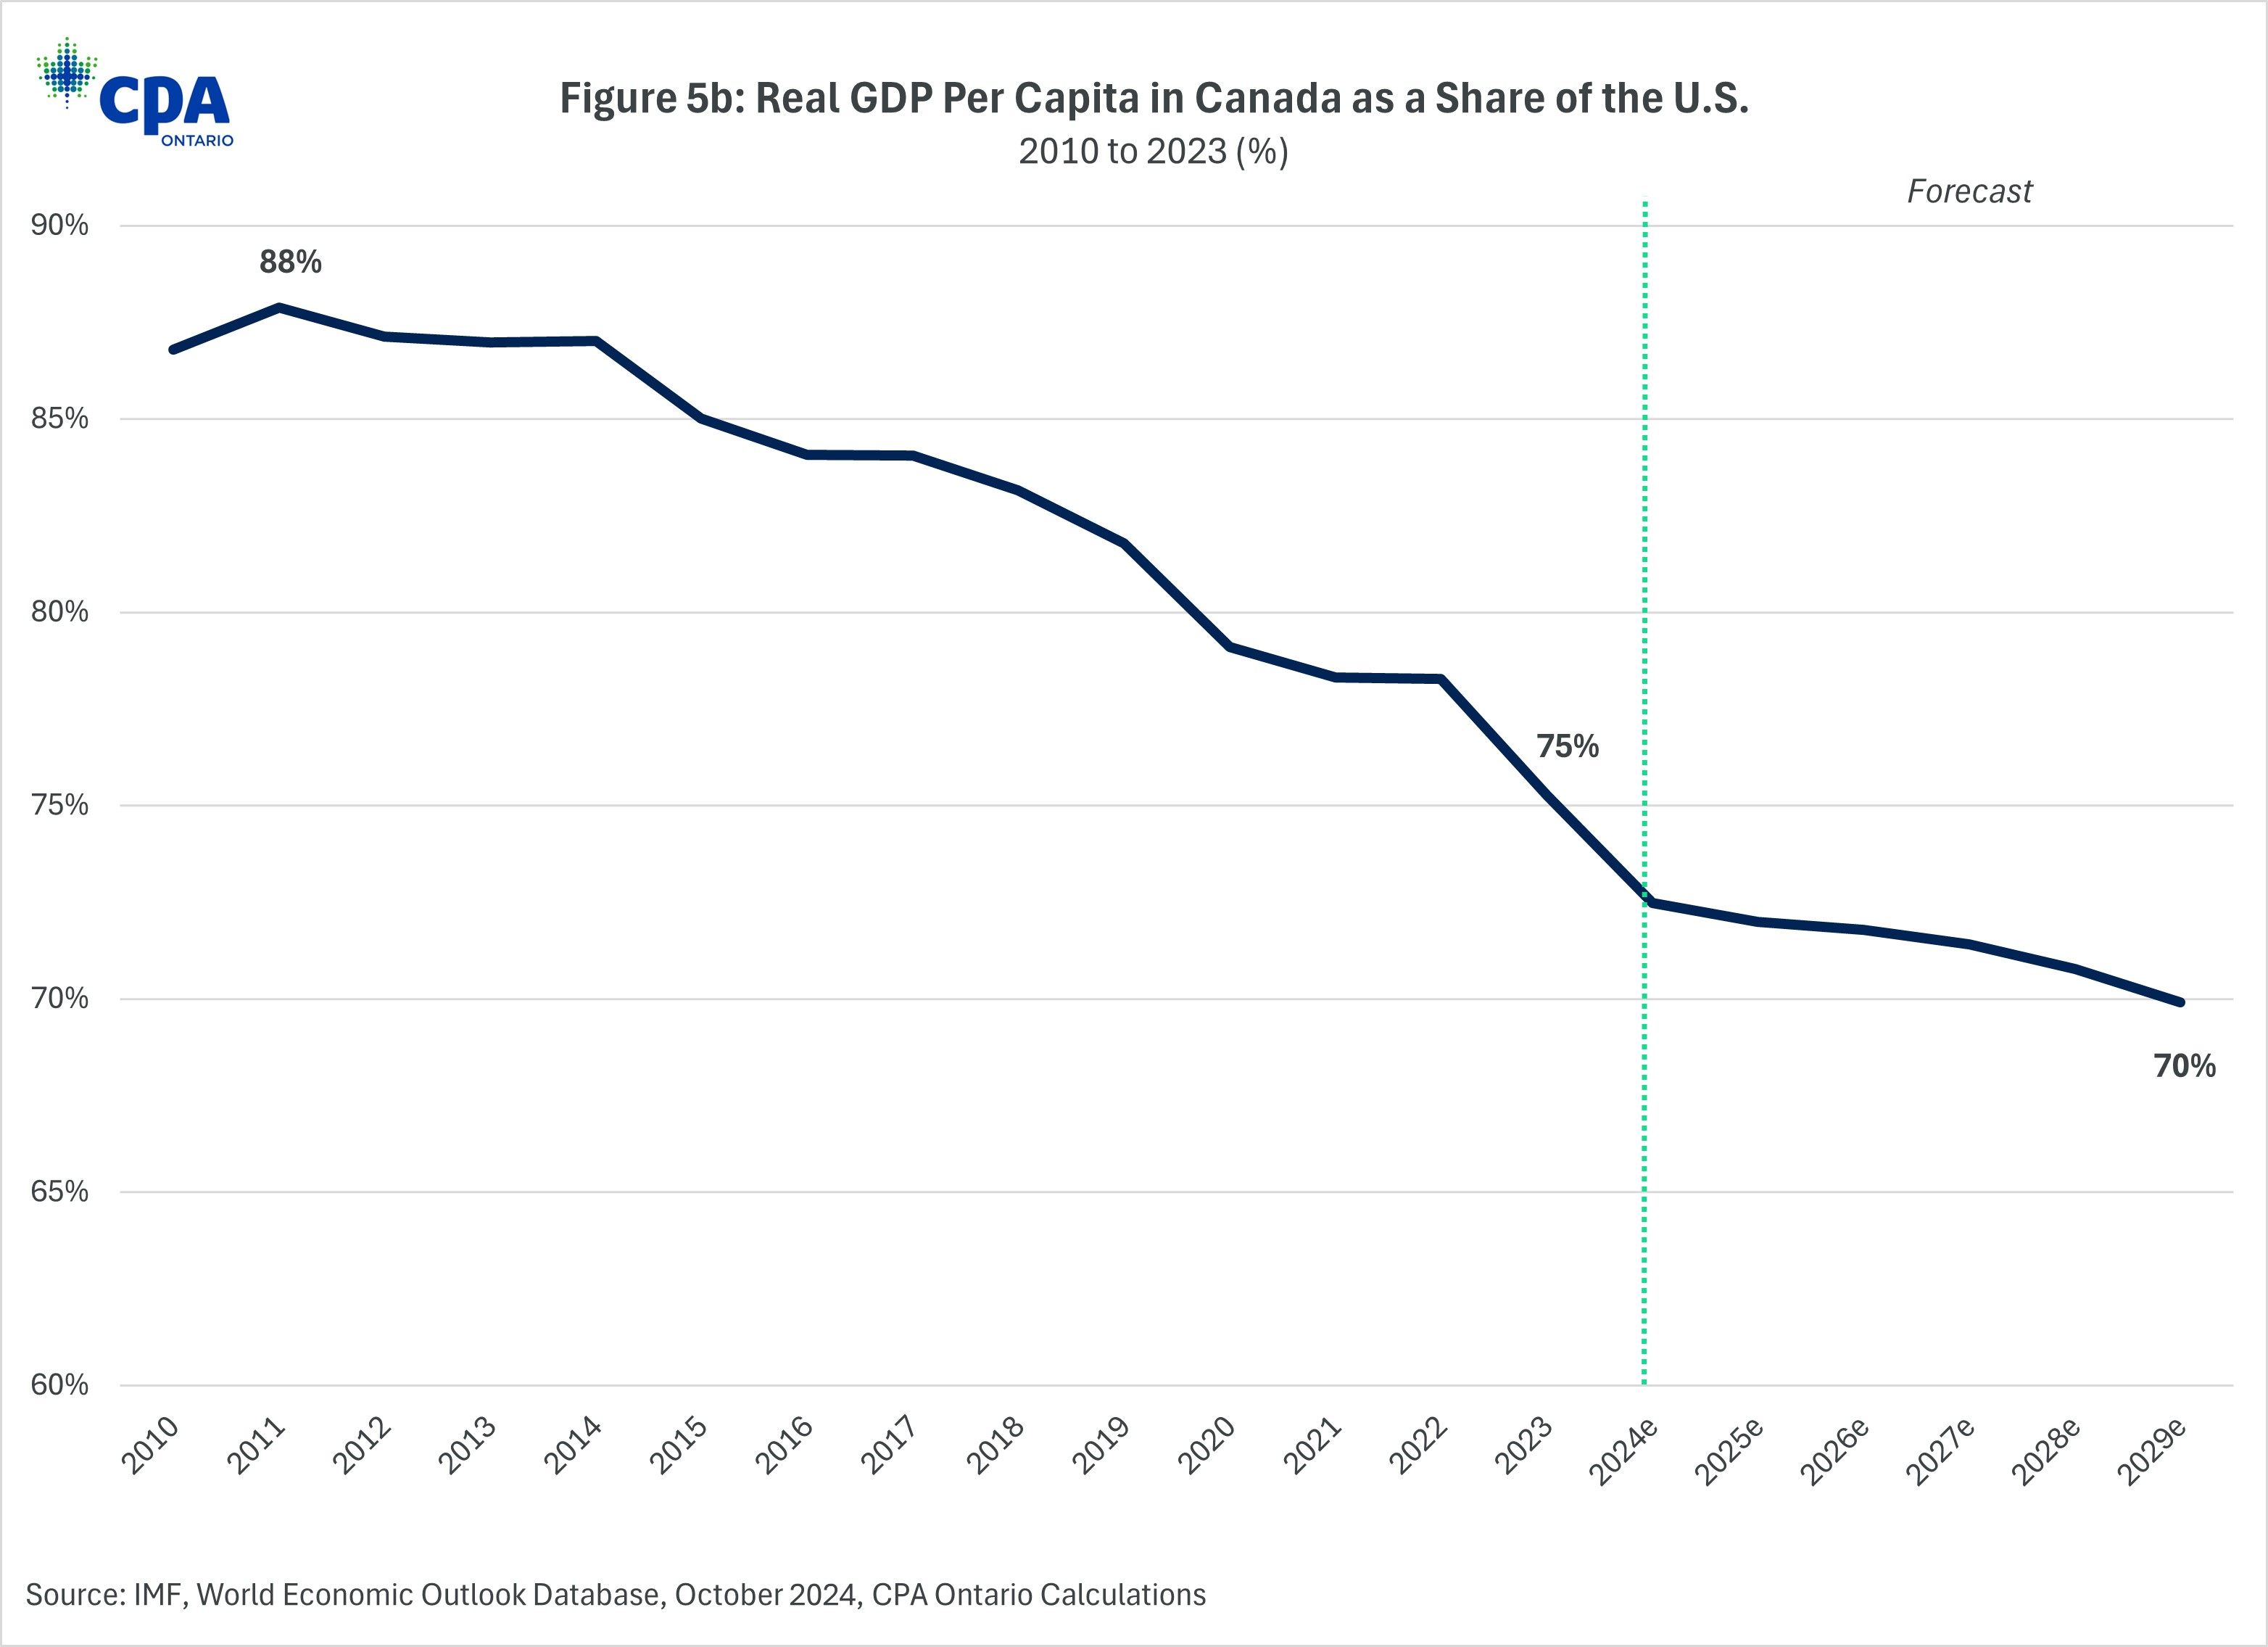
Figure 5b: Real GDP Per Capita as a Share of the U.S.
Explanations for the growing gap in living standards
What explains the stagnation in Canadian living standards and the growing gap between Canada and its peers?
First, it needs to be recognized that the U.S. is growing exceptionally fast. While Canada’s GDP per capita grew only 8.2% from 2010 to 2023, the G7 average was 12.2%. Meanwhile, the U.S. saw average living standards rise by 24.8%.
But America’s rapid growth is only one side of the coin. The other is that the Canadian economy is simply not growing fast enough to keep up with surging population levels. For example, from before the COVID-19 pandemic in Q4 2019 to Q3 2024, Canada’s real GDP grew by 7.3%, but during the same period, population growth amounted to 9.1%.
Focusing on Ontario, average living standards have faced similar dynamics as those seen nationally, with living standards in 2023 similar to what they were in 2019 (Figure 6).
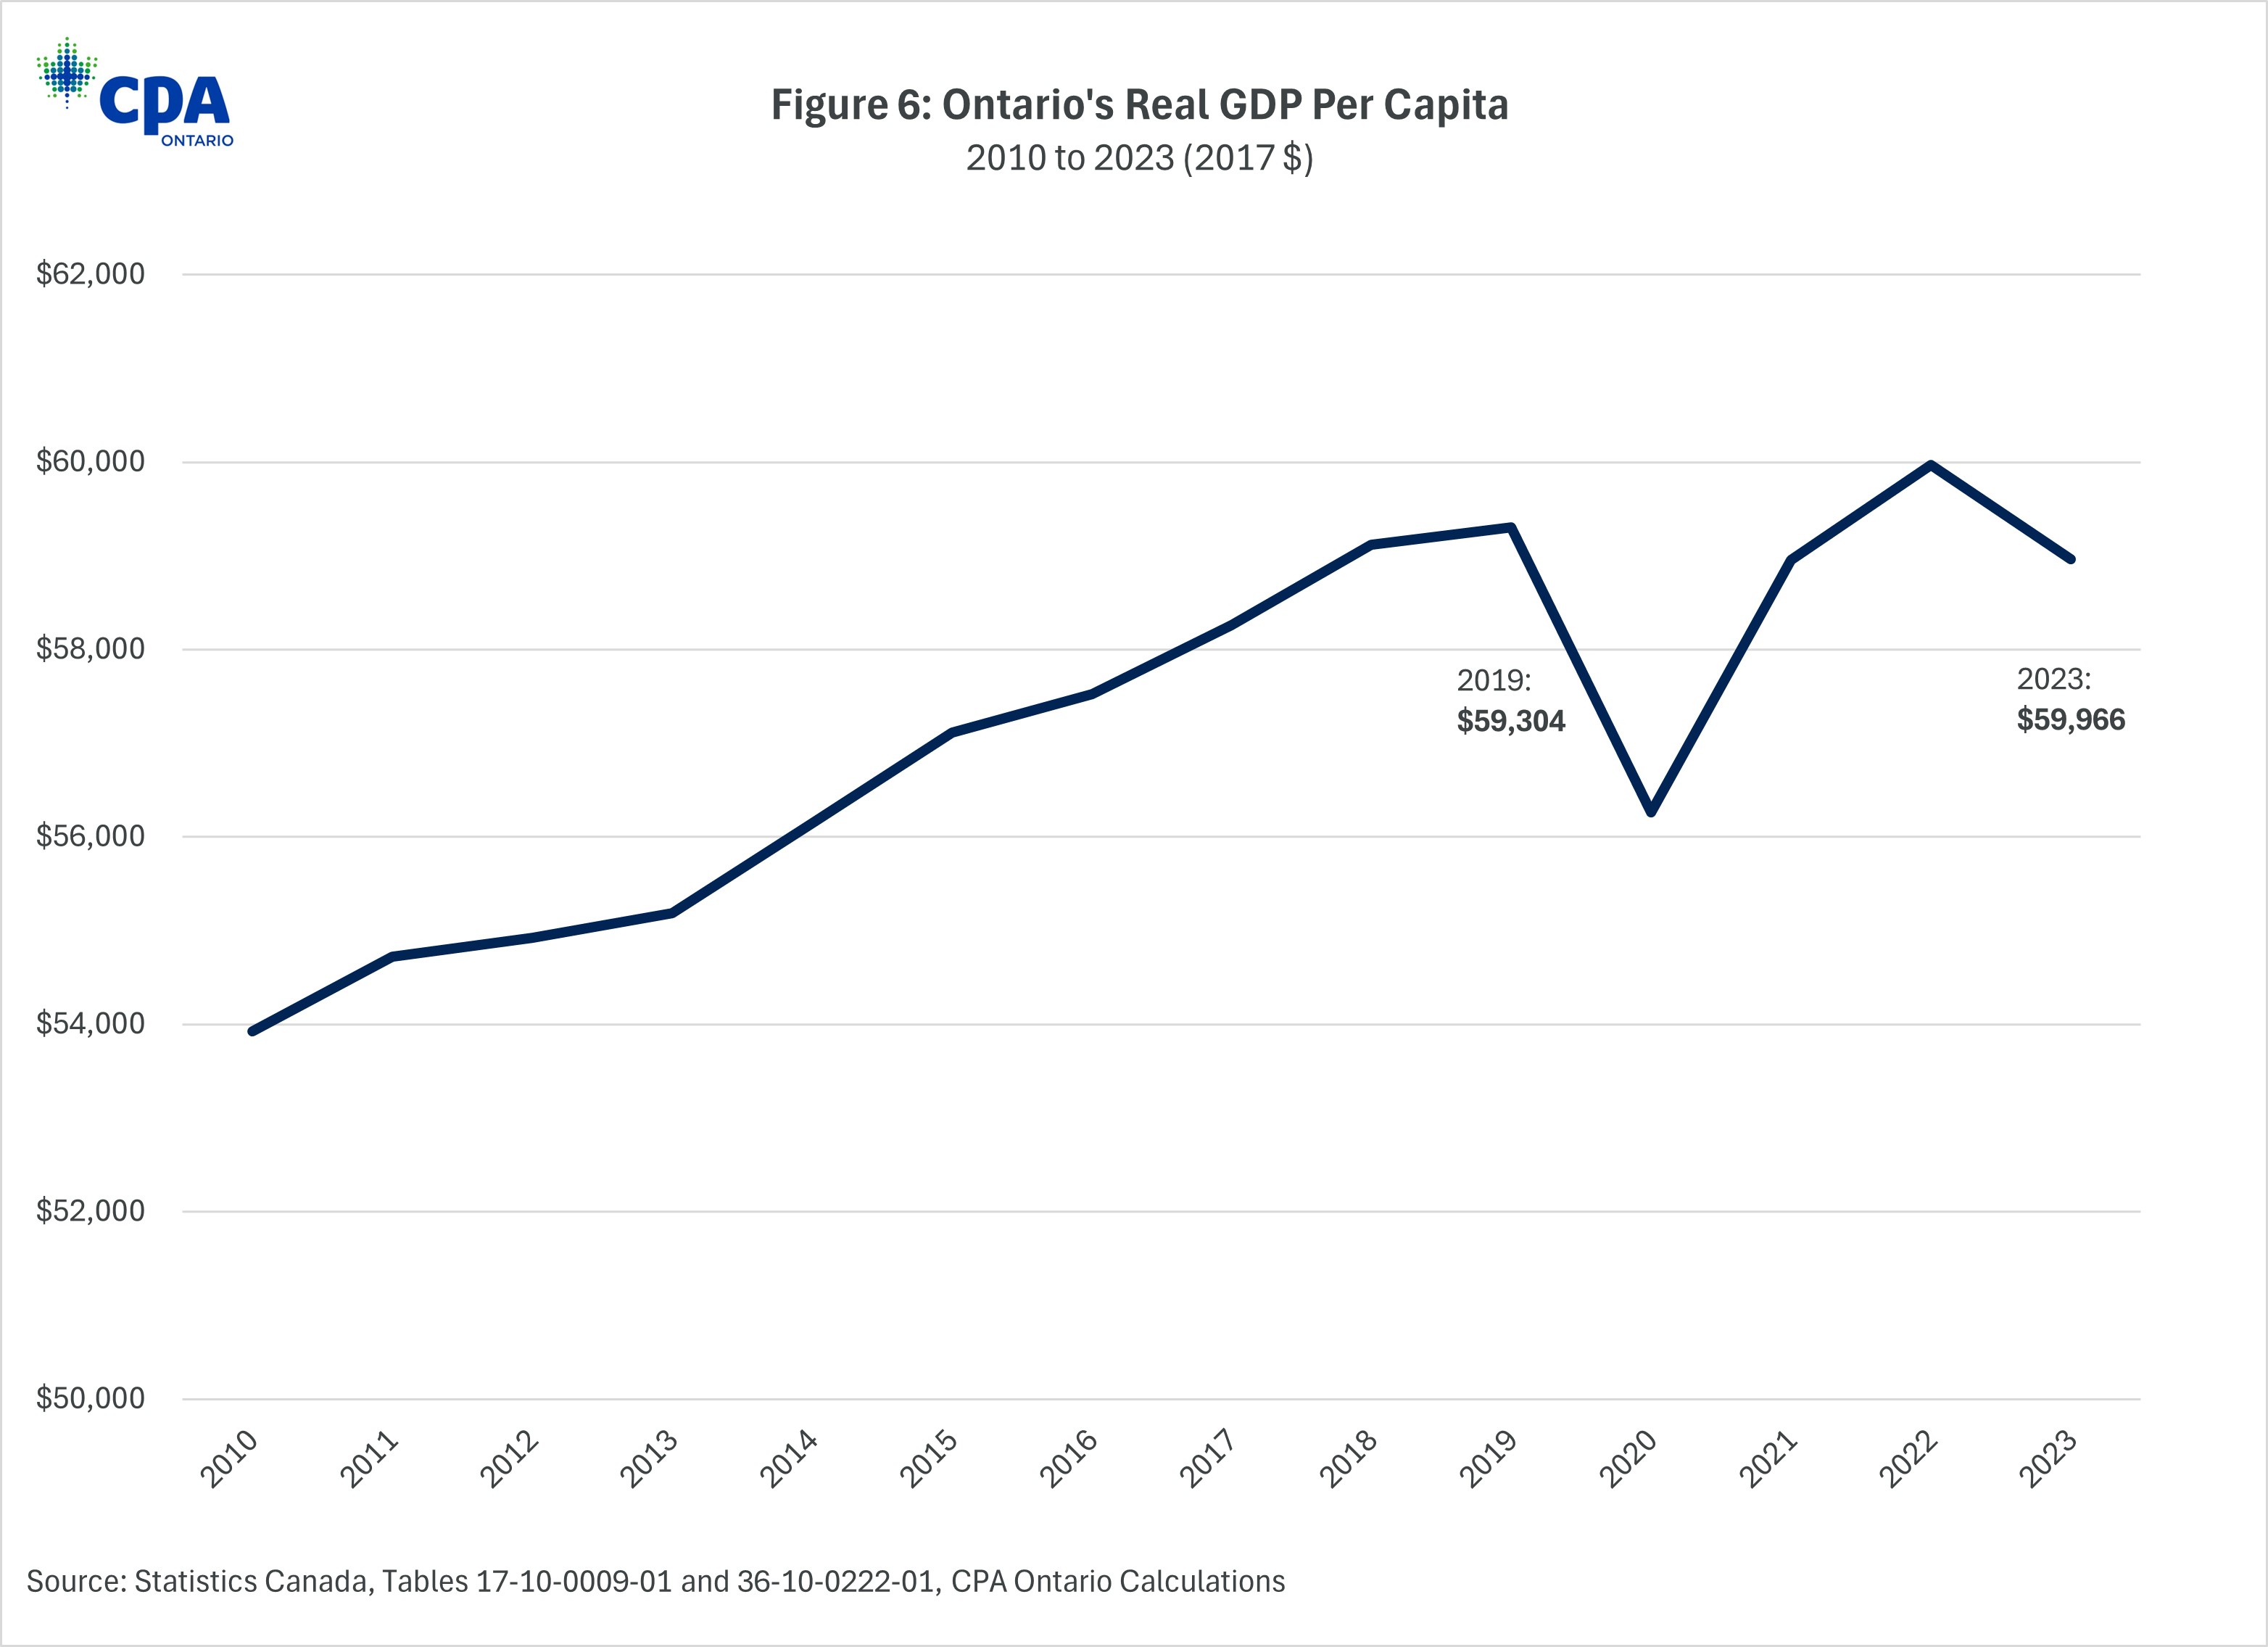
Figure 6: Ontario’s Real GDP Per Capita
Compared to other provinces, average living standards in Ontario were the fourth highest in Canada in 2023 (see Figure 7). However, there is a large gap between Alberta, Canada’s top province, and Ontario, amounting to over $16,000 or 27.5%.
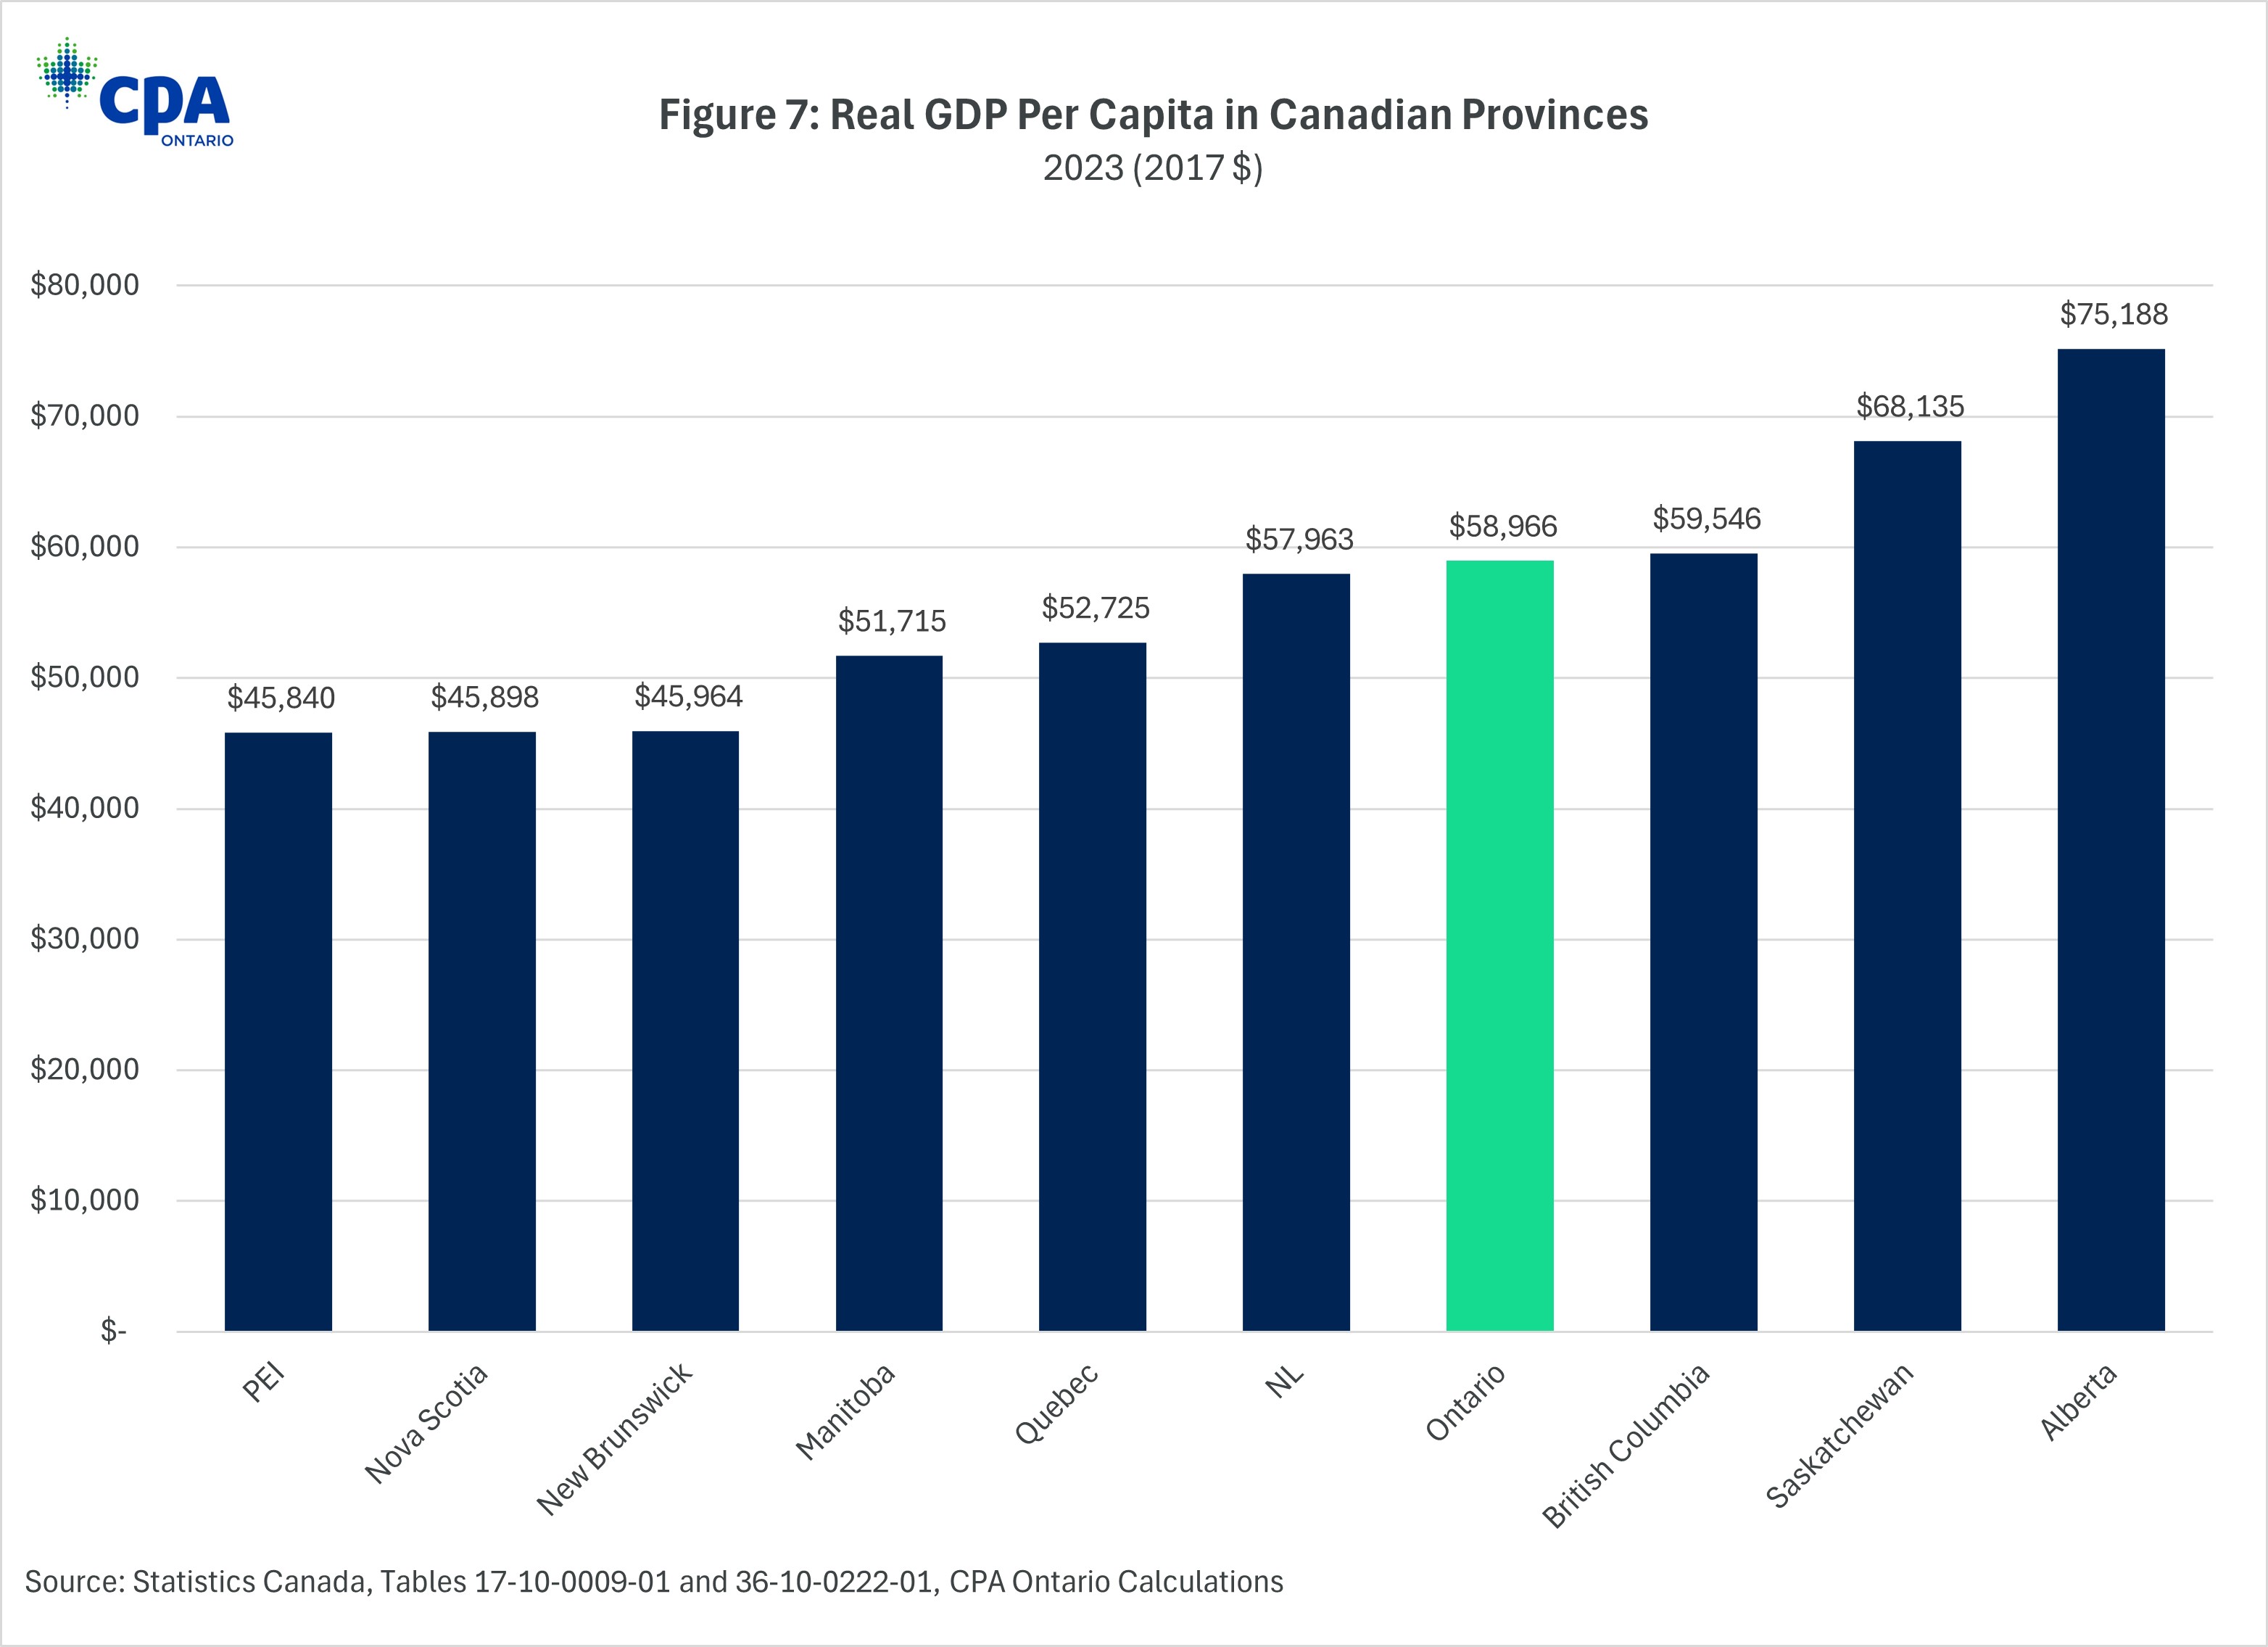
Figure 7: Real GDP Per Capita in Canadian Provinces
While the living standards gap is pronounced at the national level between Canada and the U.S., the contrast is even starker at the subnational level. Among the 10 provinces and states with the lowest GDP per capita between the two countries, six are Canadian, including Ontario, which has the 10th lowest average living standards (Figure 8). Based on analysis by University of Calgary economist Trevor Tombe, when adjusting for exchange rates and USD purchasing power parity, Ontario’s real GDP per capita in 2023 was $59,700, slightly above Alabama’s $58,800.
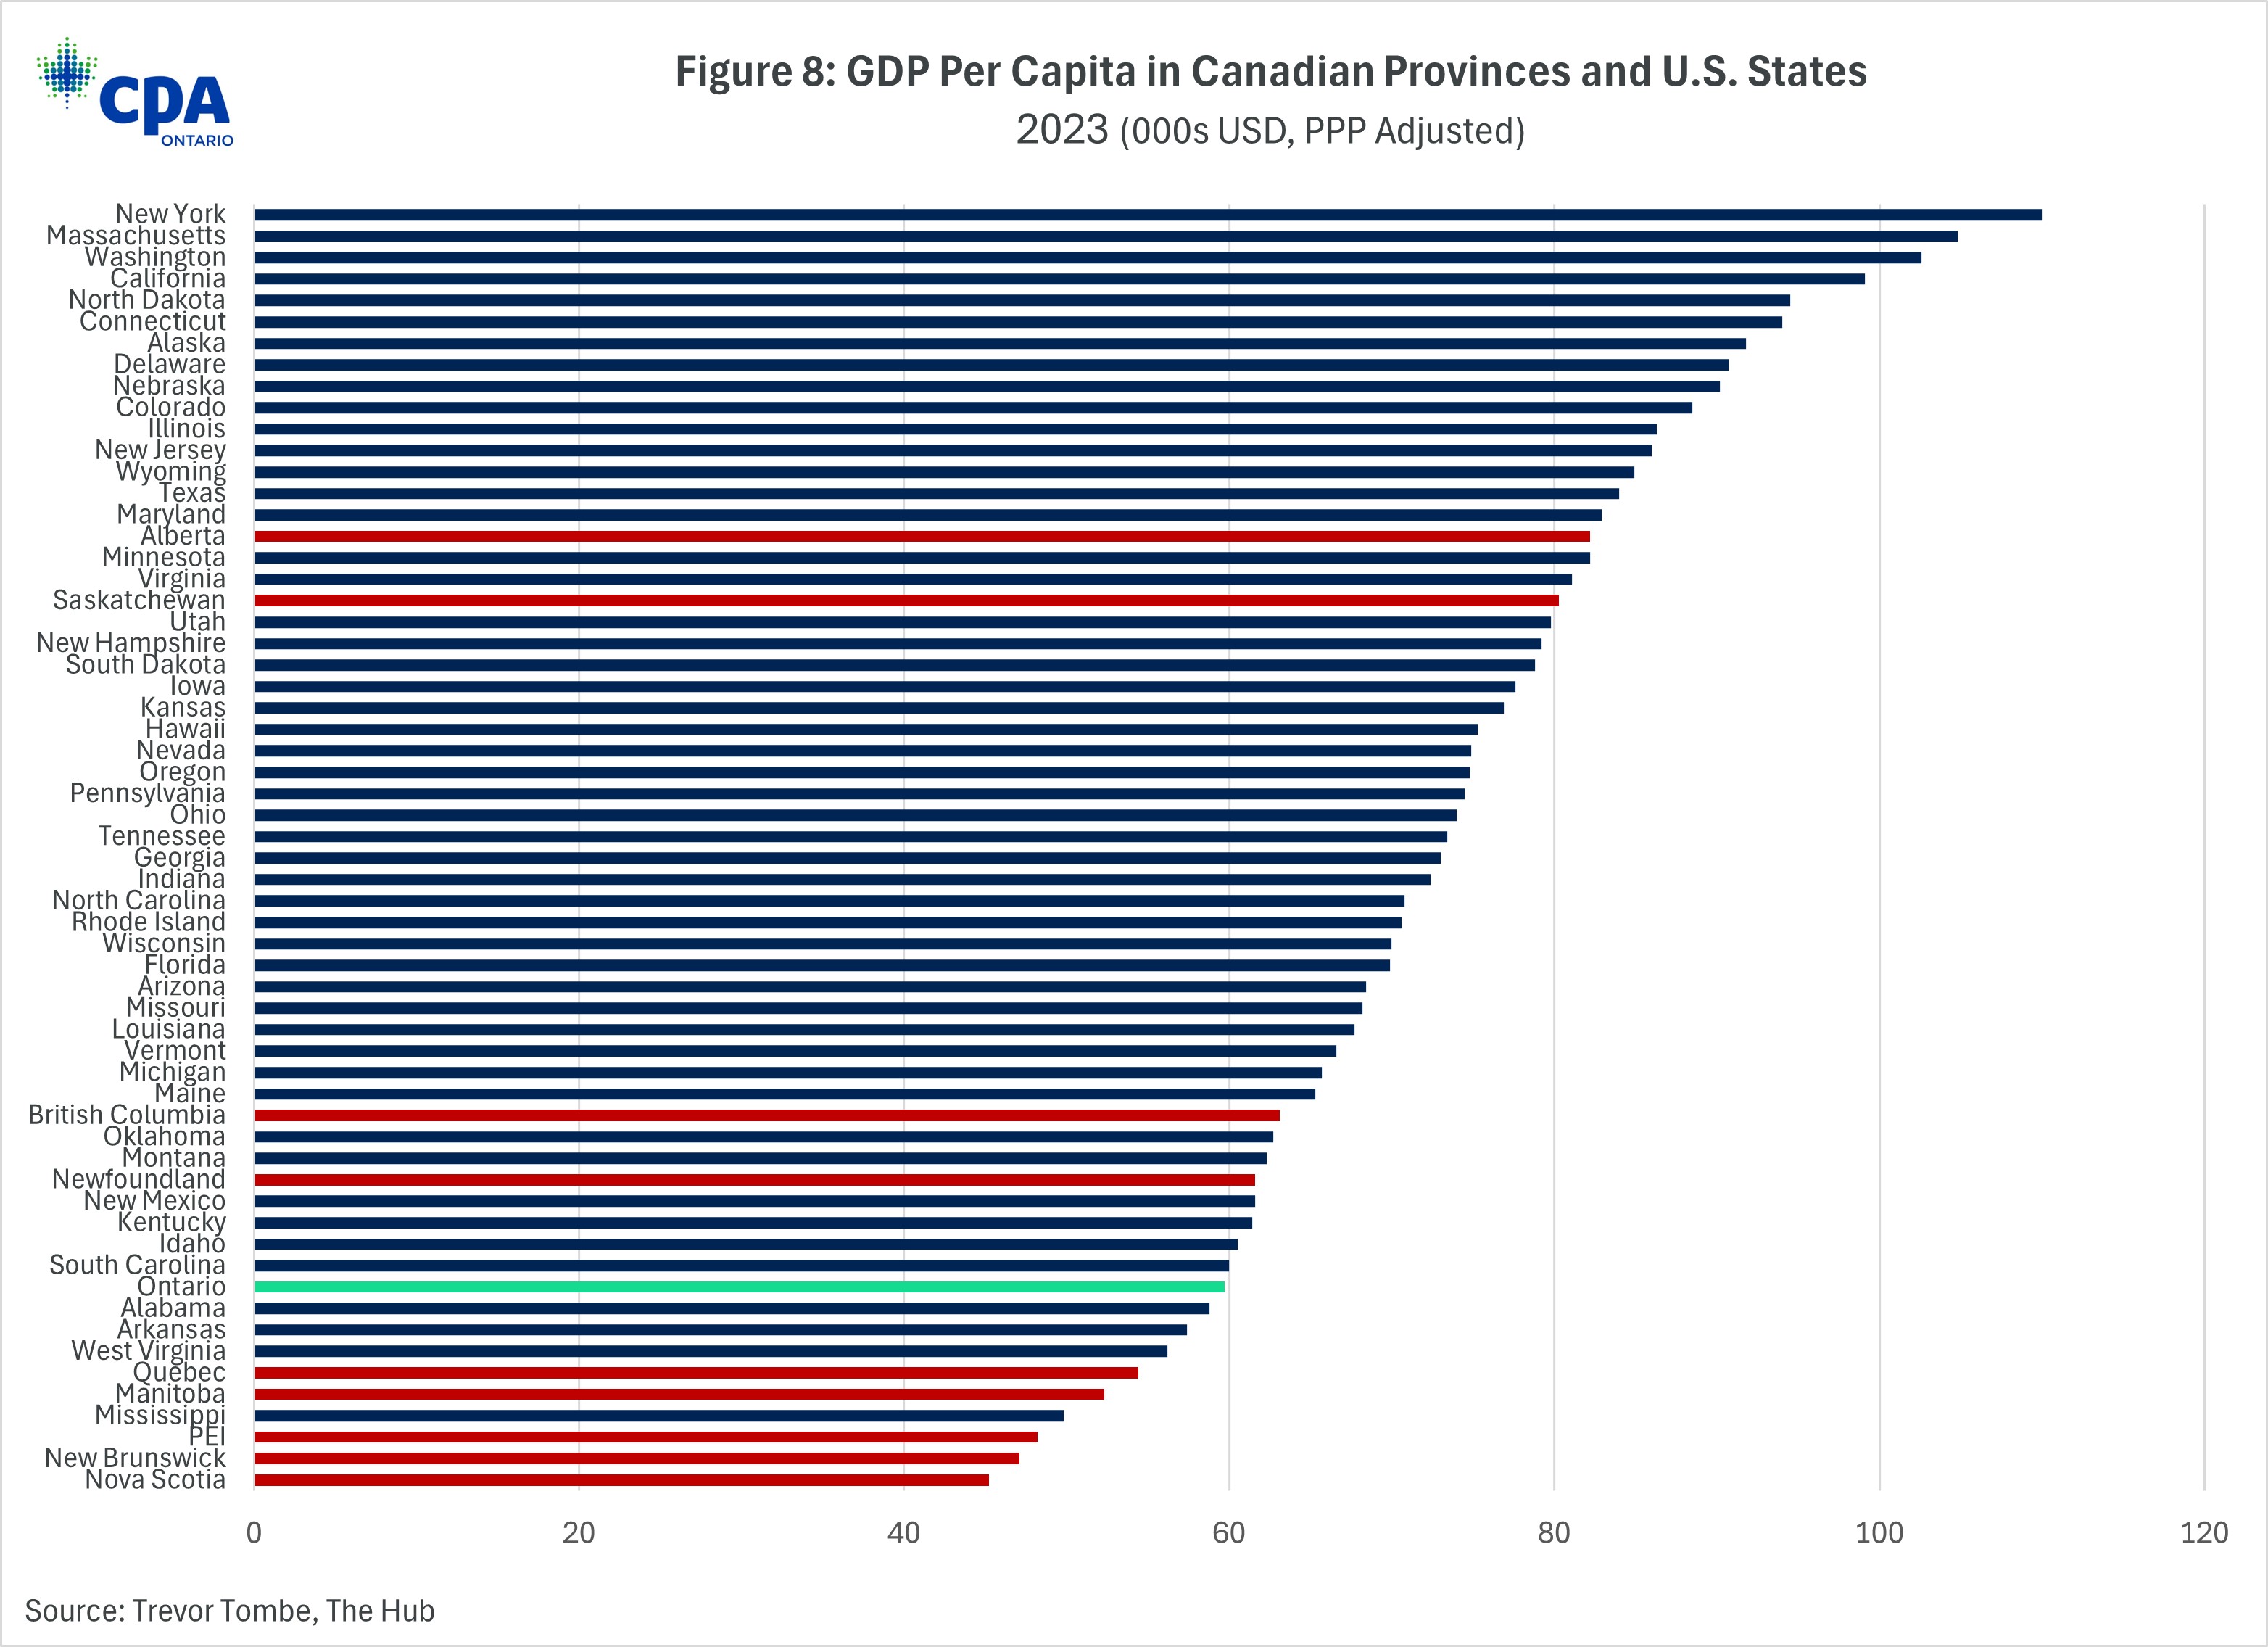
Figure 8: GDP Per Capita in Canadian Provinces and U.S. States
For Canada and Ontario to catch up, it will require charting a much stronger economic growth path. But two interrelated issues are holding Canada back: low productivity growth and weak investment where it counts.
Productivity Woes
Productivity gauges how efficiently an economy converts inputs, like hours worked, into outputs, typically measured by GDP. It is a key driver of income growth and improved living standards. When an economy generates more output from the same input, material well-being improves. In practical terms, higher productivity leads to increased incomes, more leisure time, lower costs, and greater funding for essential public services like healthcare and education, assuming other factors remain constant.
Canada has a clear productivity problem—a concern echoed by many professionals. In a survey of CPAs conducted by CPA Ontario in late 2024, 84% of respondents agreed that they are worried about Canada’s productivity and economic growth performance. This sentiment was also highlighted by Bank of Canada Senior Deputy Governor Carolyn Rogers in a 2024 speech, where she remarked, “An economy with strong productivity can have faster growth, more jobs, and higher wages with less risk of inflation. That’s why I want to talk about Canada’s long-standing, poor record on productivity and show you just how big the problem is. You’ve seen those signs that say, ‘In emergency, break glass.’ Well, it’s time to break the glass.”
The data bears out our productivity woes. As of 2023, Canada’s productivity level, as measured by GDP per hour worked, was below the OECD average and the second lowest among G7 countries ahead of only Japan. That year, Canada’s labour productivity was only 84% of the G7 average and 72% of the U.S. (see Figure 9).
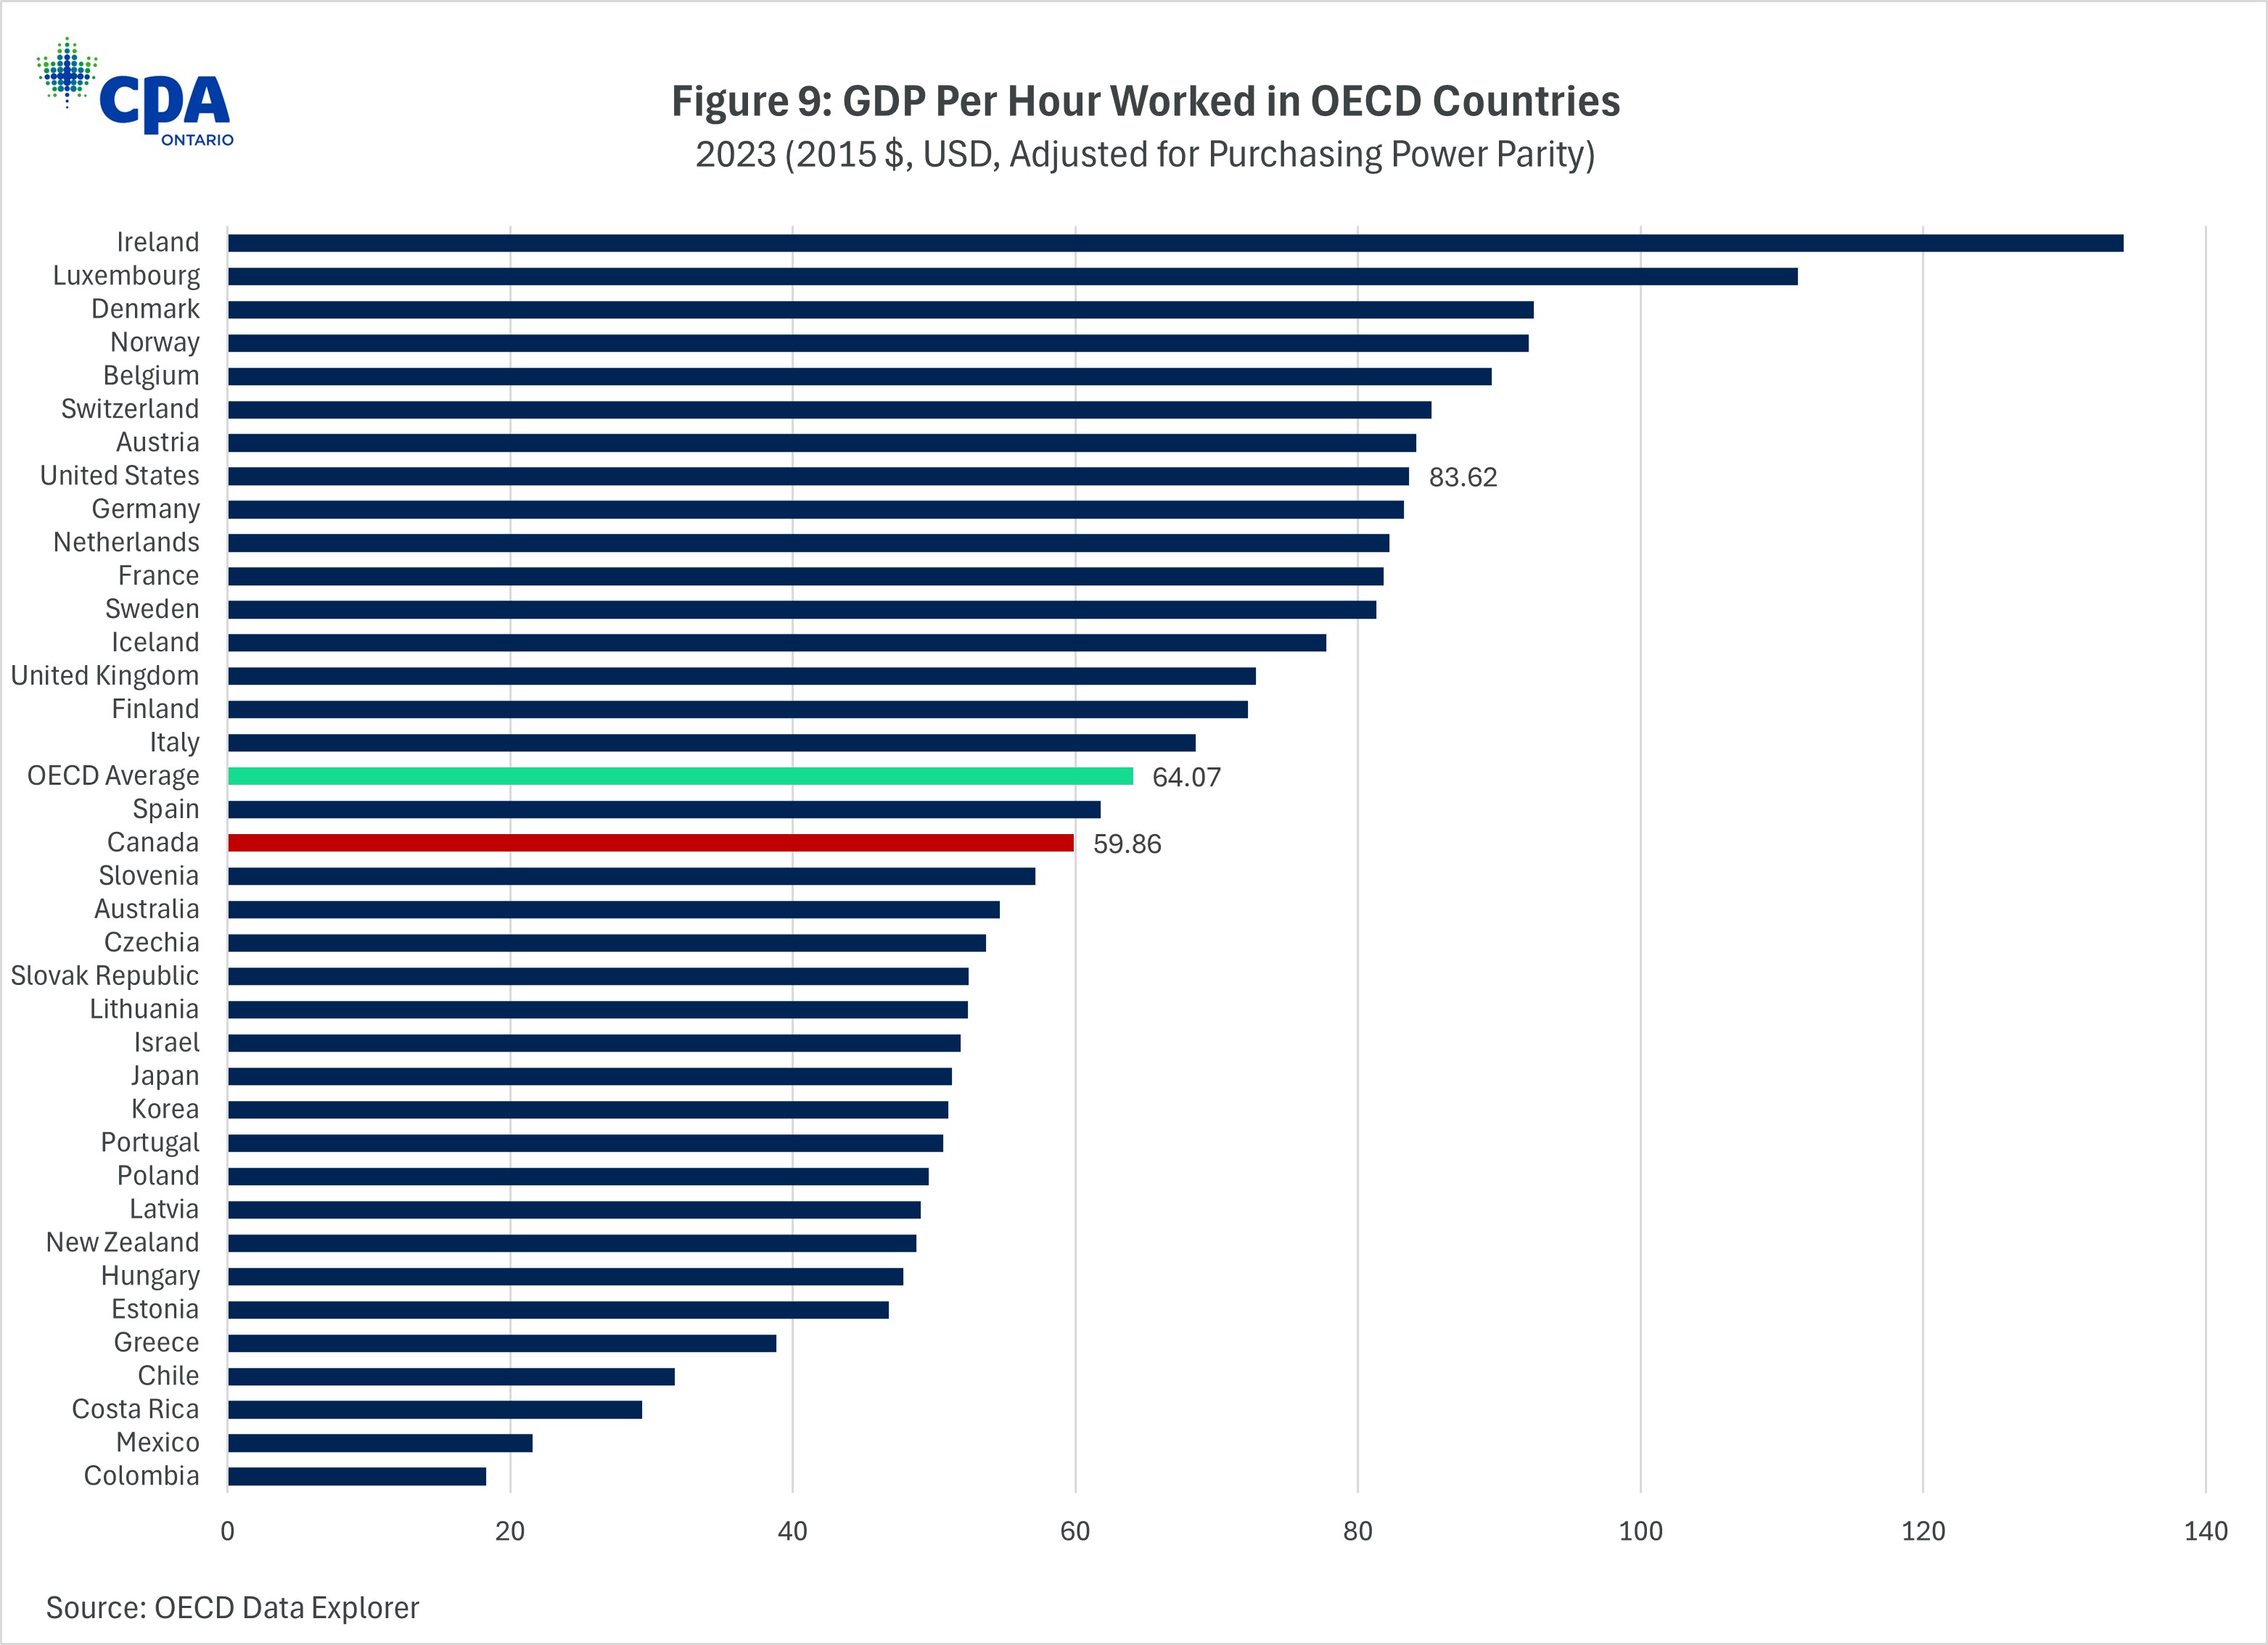
Figure 9: GDP Per Hour Worked in OECD Countries
In fact, Canada’s labour productivity has been declining relative to the U.S. for decades (see Figures 10a and 10b). The growing gap in real GDP per hour worked is evident in the diverging lines in Figure 10a. In the 1970s, Canada’s labour productivity was only slightly lower than U.S. levels. However, from the mid-1980s to the turn of the century, the gap widened further and has grown significantly since the early 2000s. Figure 10b shows that Canada’s productivity level as a share of the U.S. peaked in 1977 at 92% but has since declined steadily reaching its lowest point in 2023 at 72%.
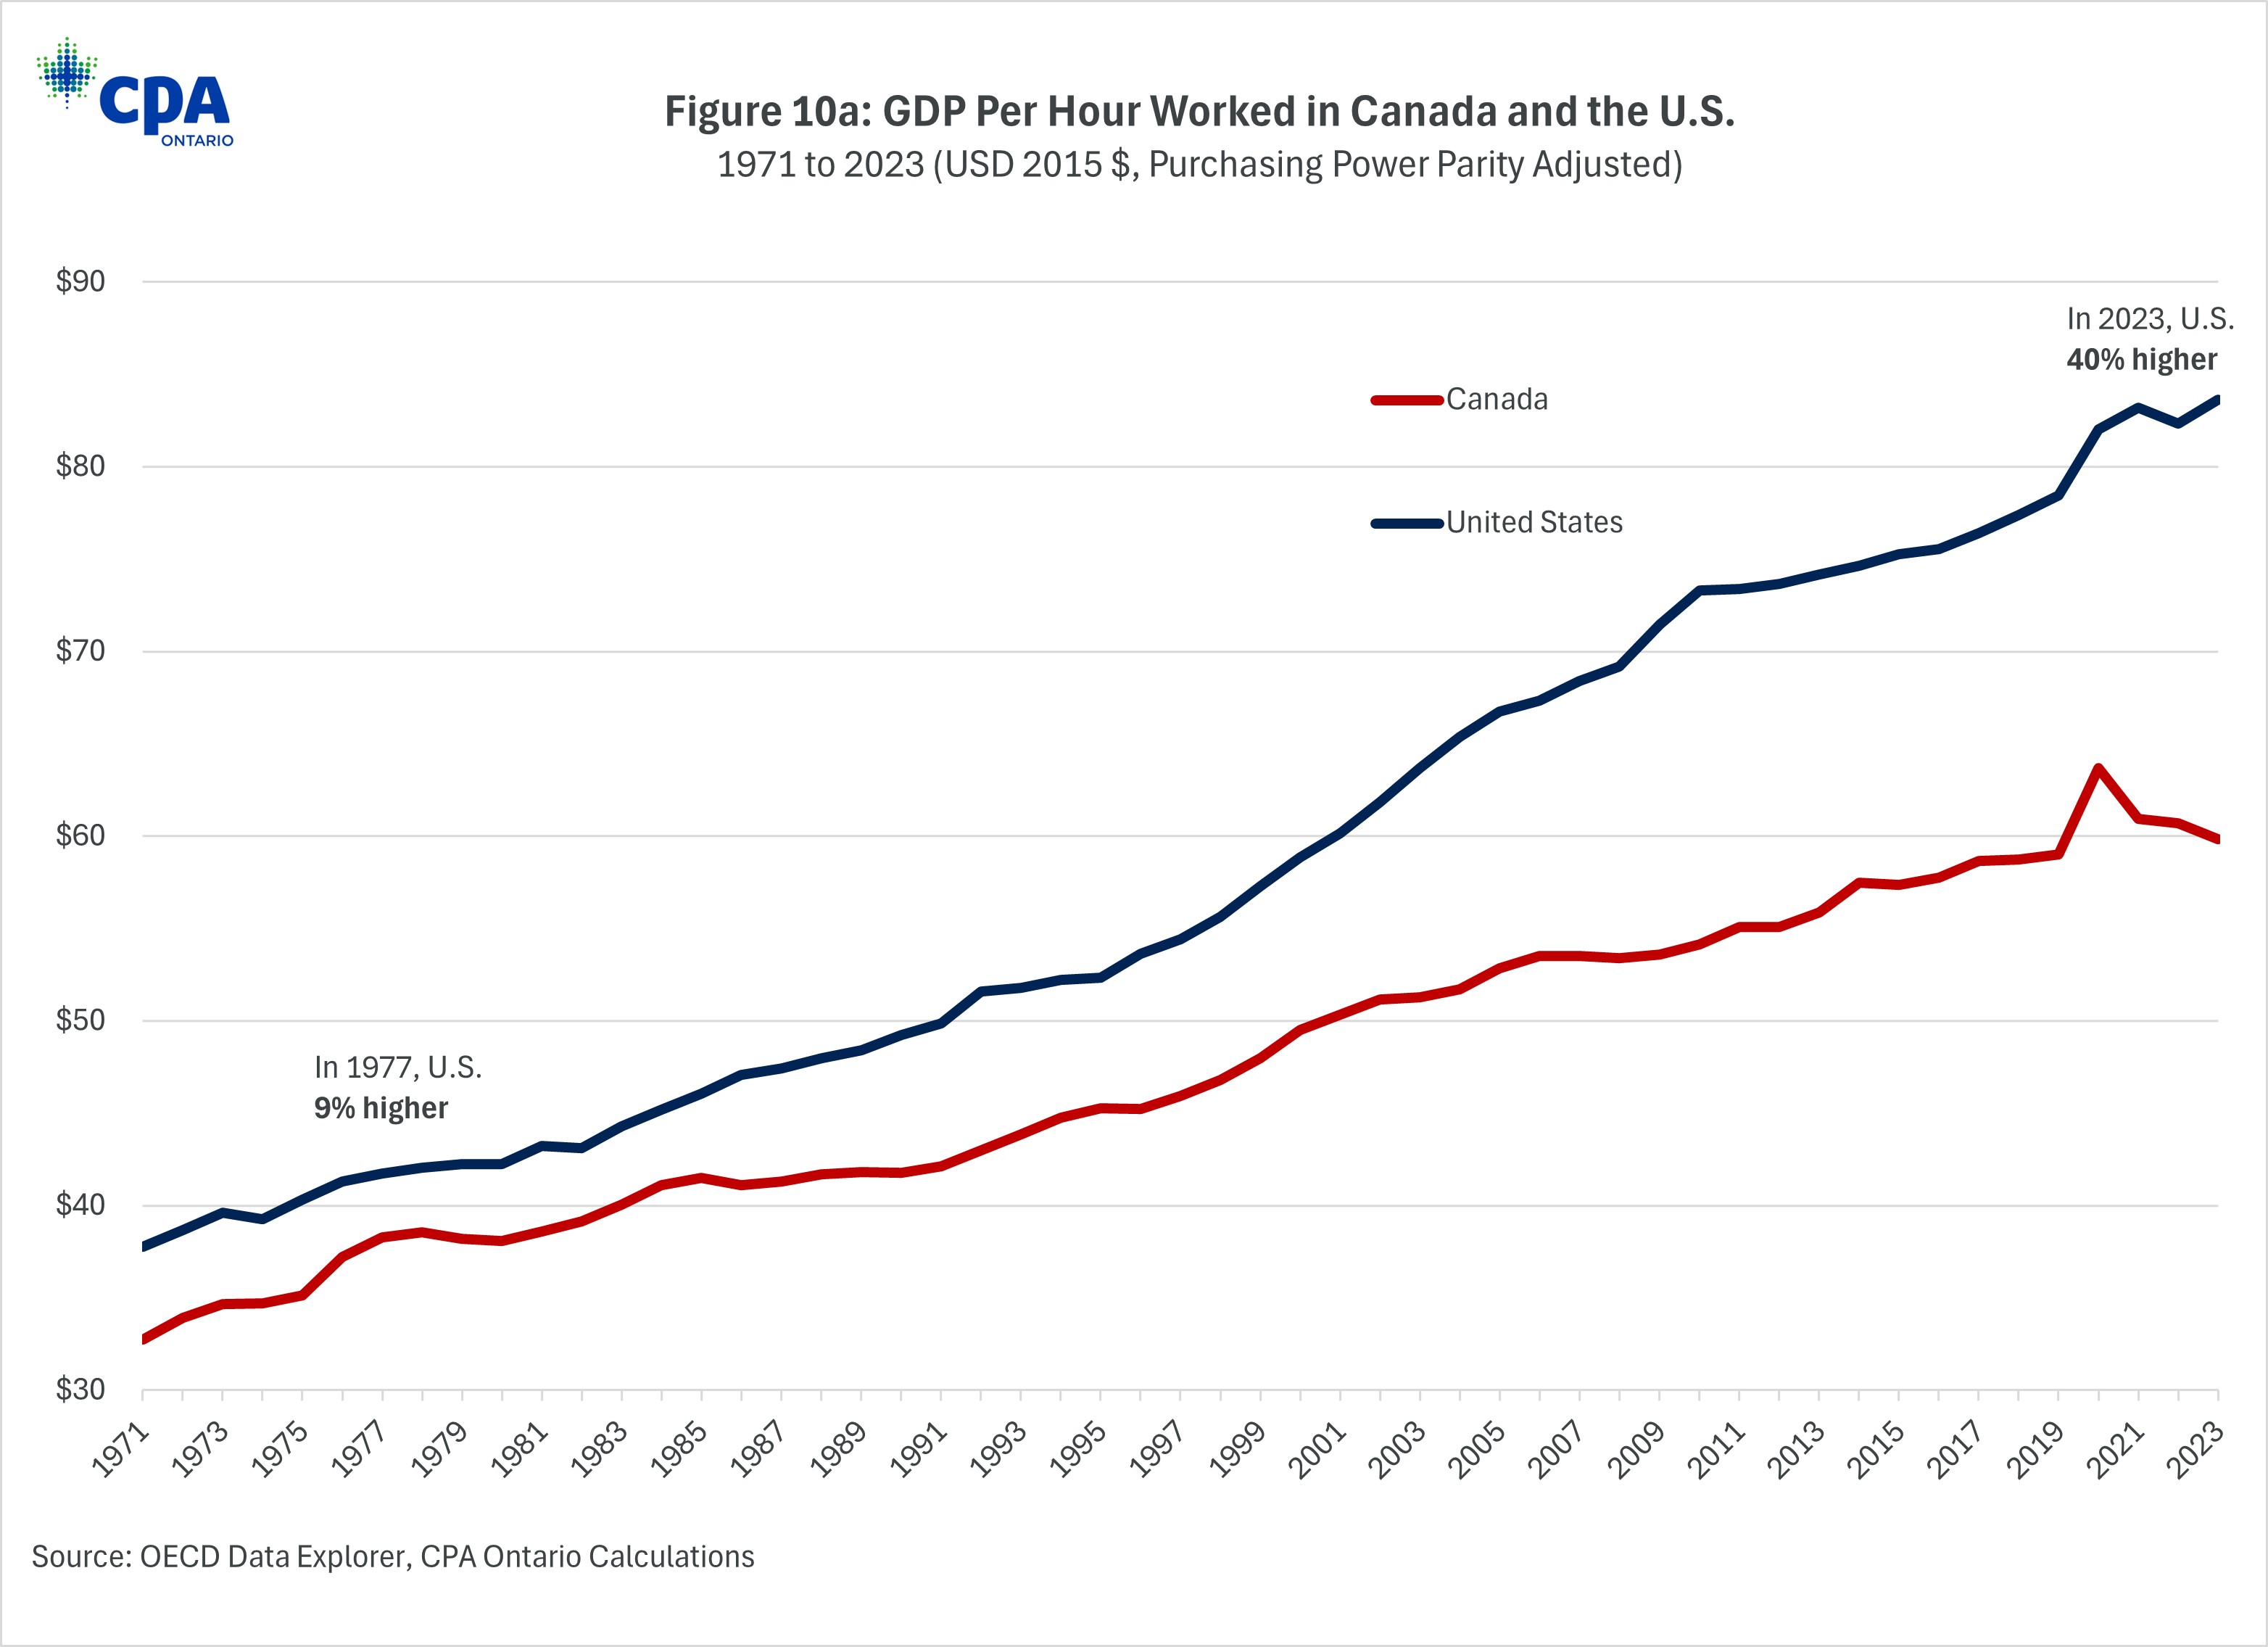
Figure 10a: GDP Per Hour Worked in Canada and the U.S.
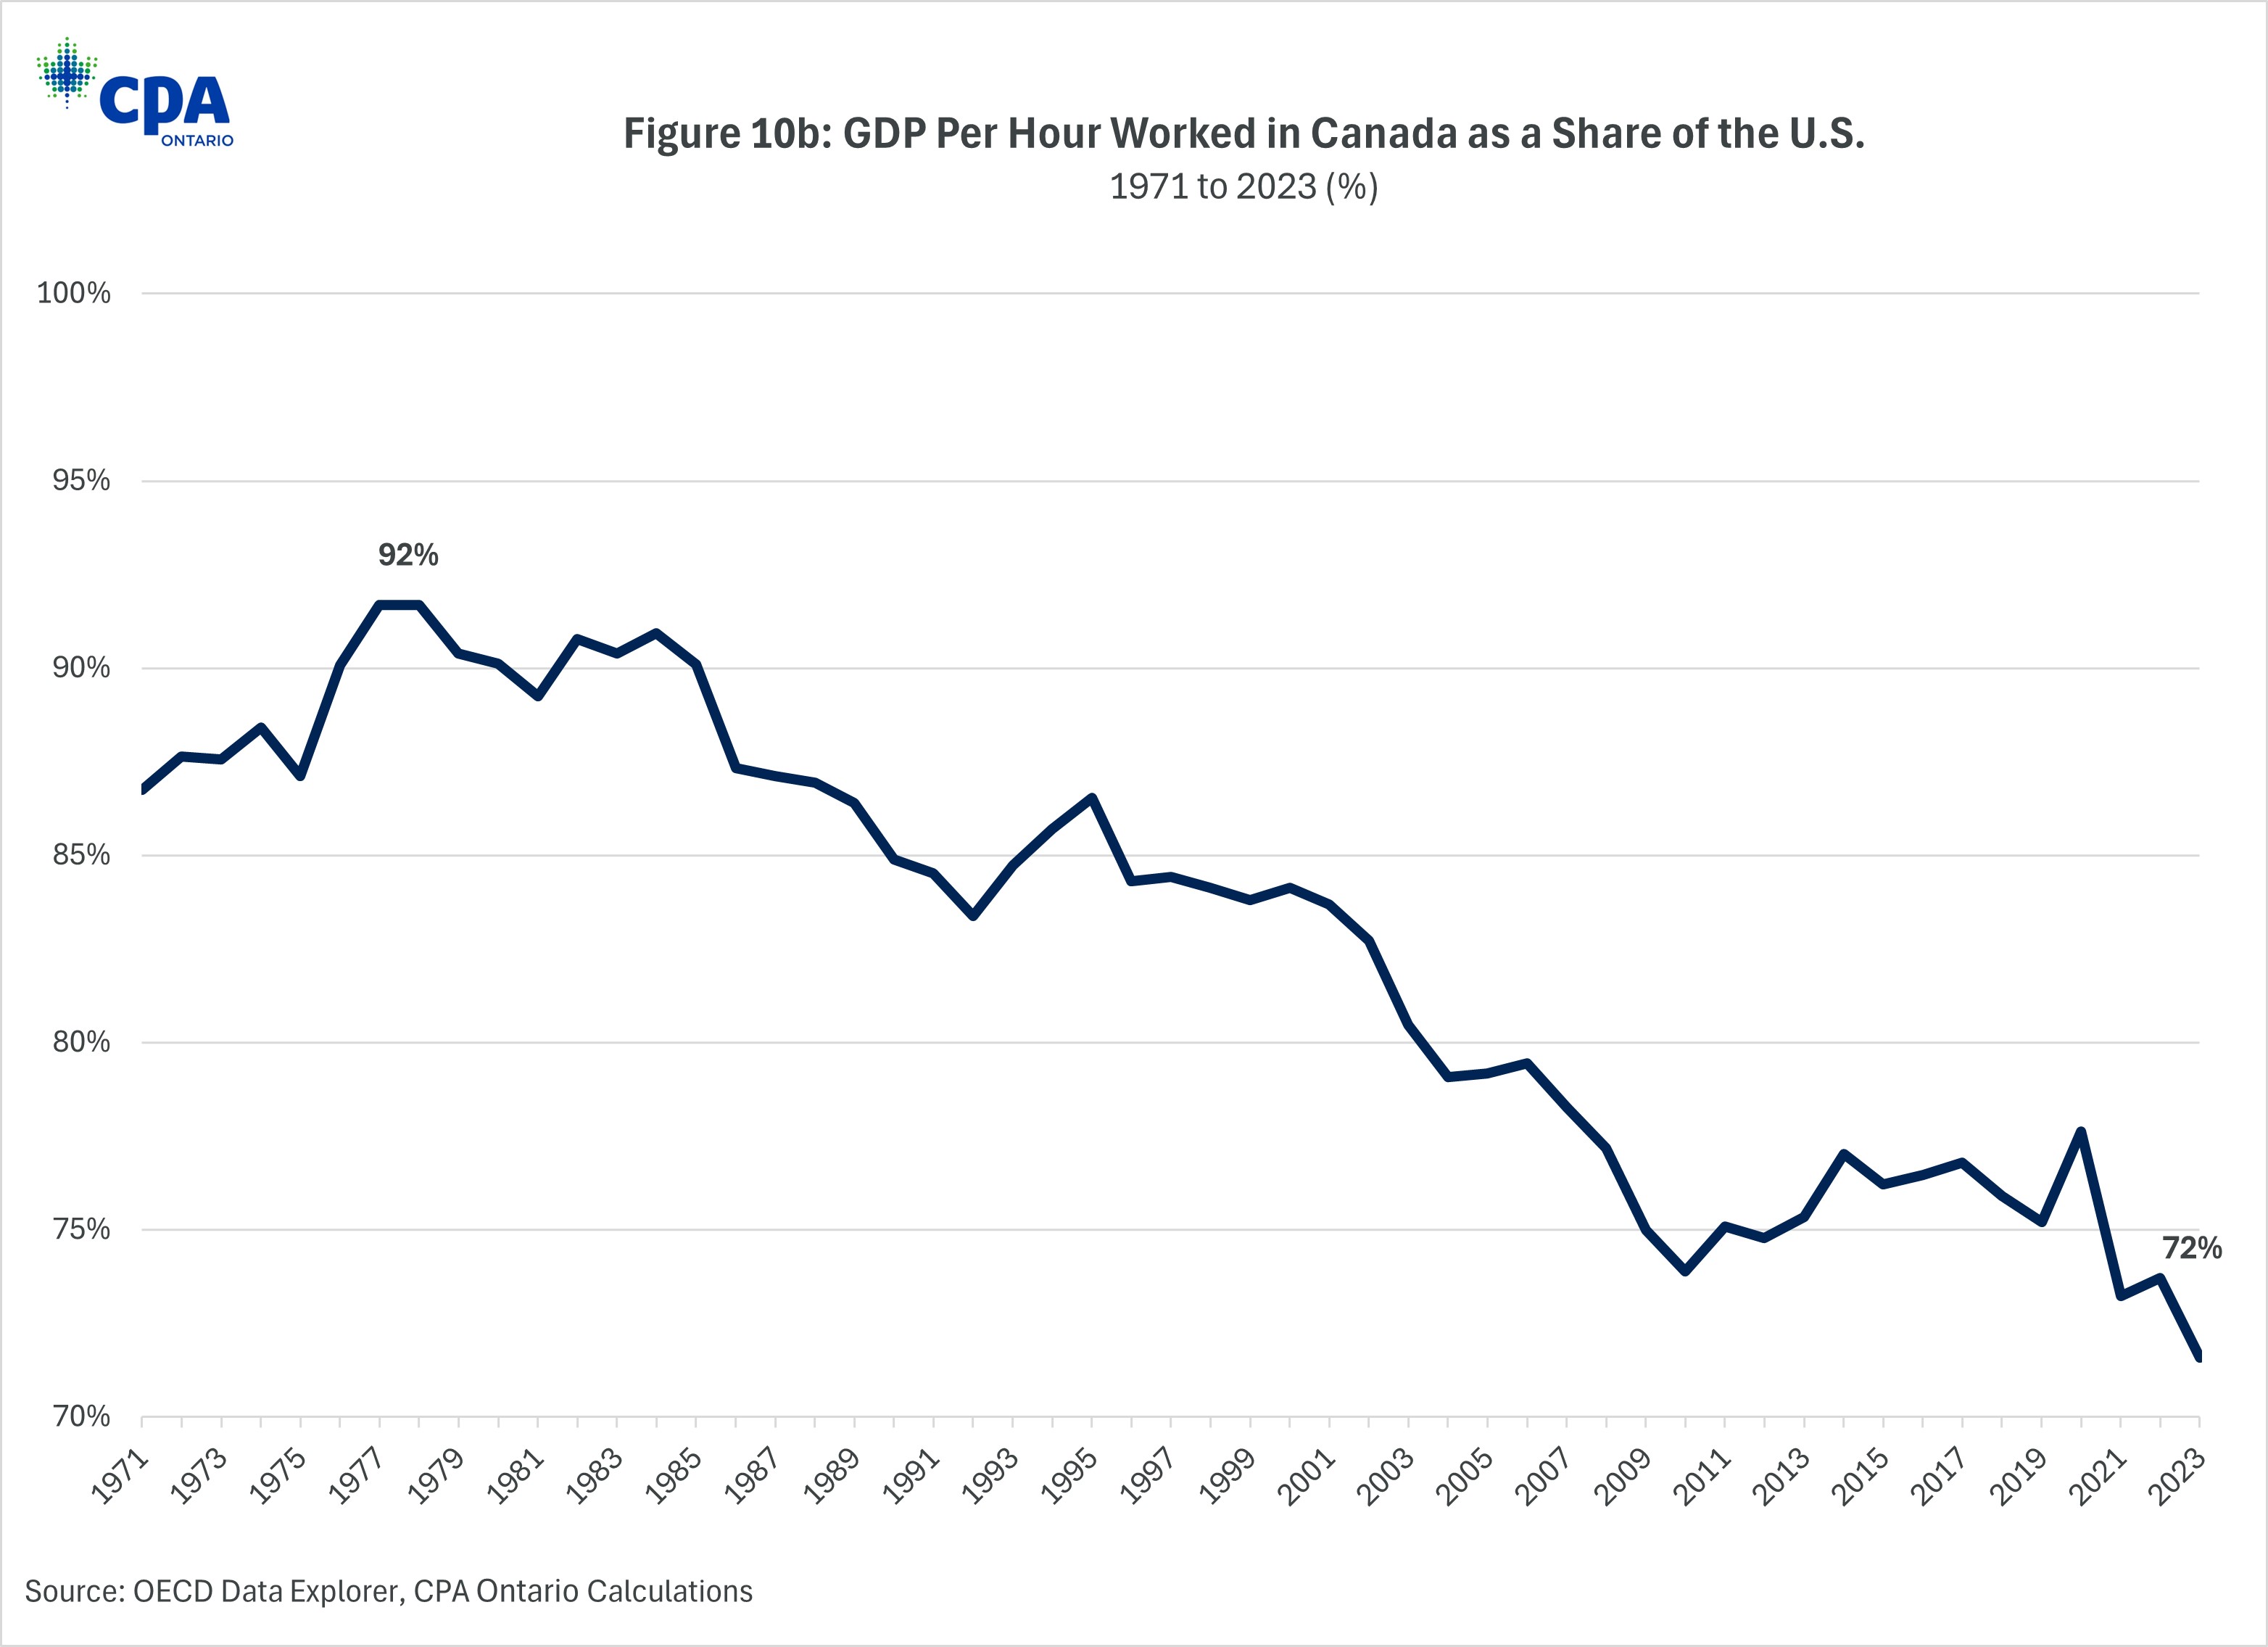
Figure 10b: GDP Per Hour Worked in Canada as a Share of the U.S.
Declining relative productivity largely explains why average American living standards are growing much faster than Canada’s. A key driver of this productivity gap is different levels of business investment between the two countries. For Canadian workers to be more productive, they need access to capital, like machinery and equipment, and innovations stemming from intellectual property (IP). While the U.S. has much higher levels of business investment relative to the size of its economy, Canada has experienced concerning declines over the past decade in the types of capital that workers need to boost their productivity.
Before turning to an analysis of investment, consider the wide variation in productivity across the provinces. When comparing Canadian provinces (Figure 11), Ontario’s GDP per hour worked of $62.20 sits slightly below the Canadian average of $63.50. The provinces with the highest productivity levels are those with strong oil and gas extraction and mining industries, as this industrial activity is capital intensive, producing higher levels of labour productivity. Alberta, Canada’s most productive province, is 25% more productive than Ontario.
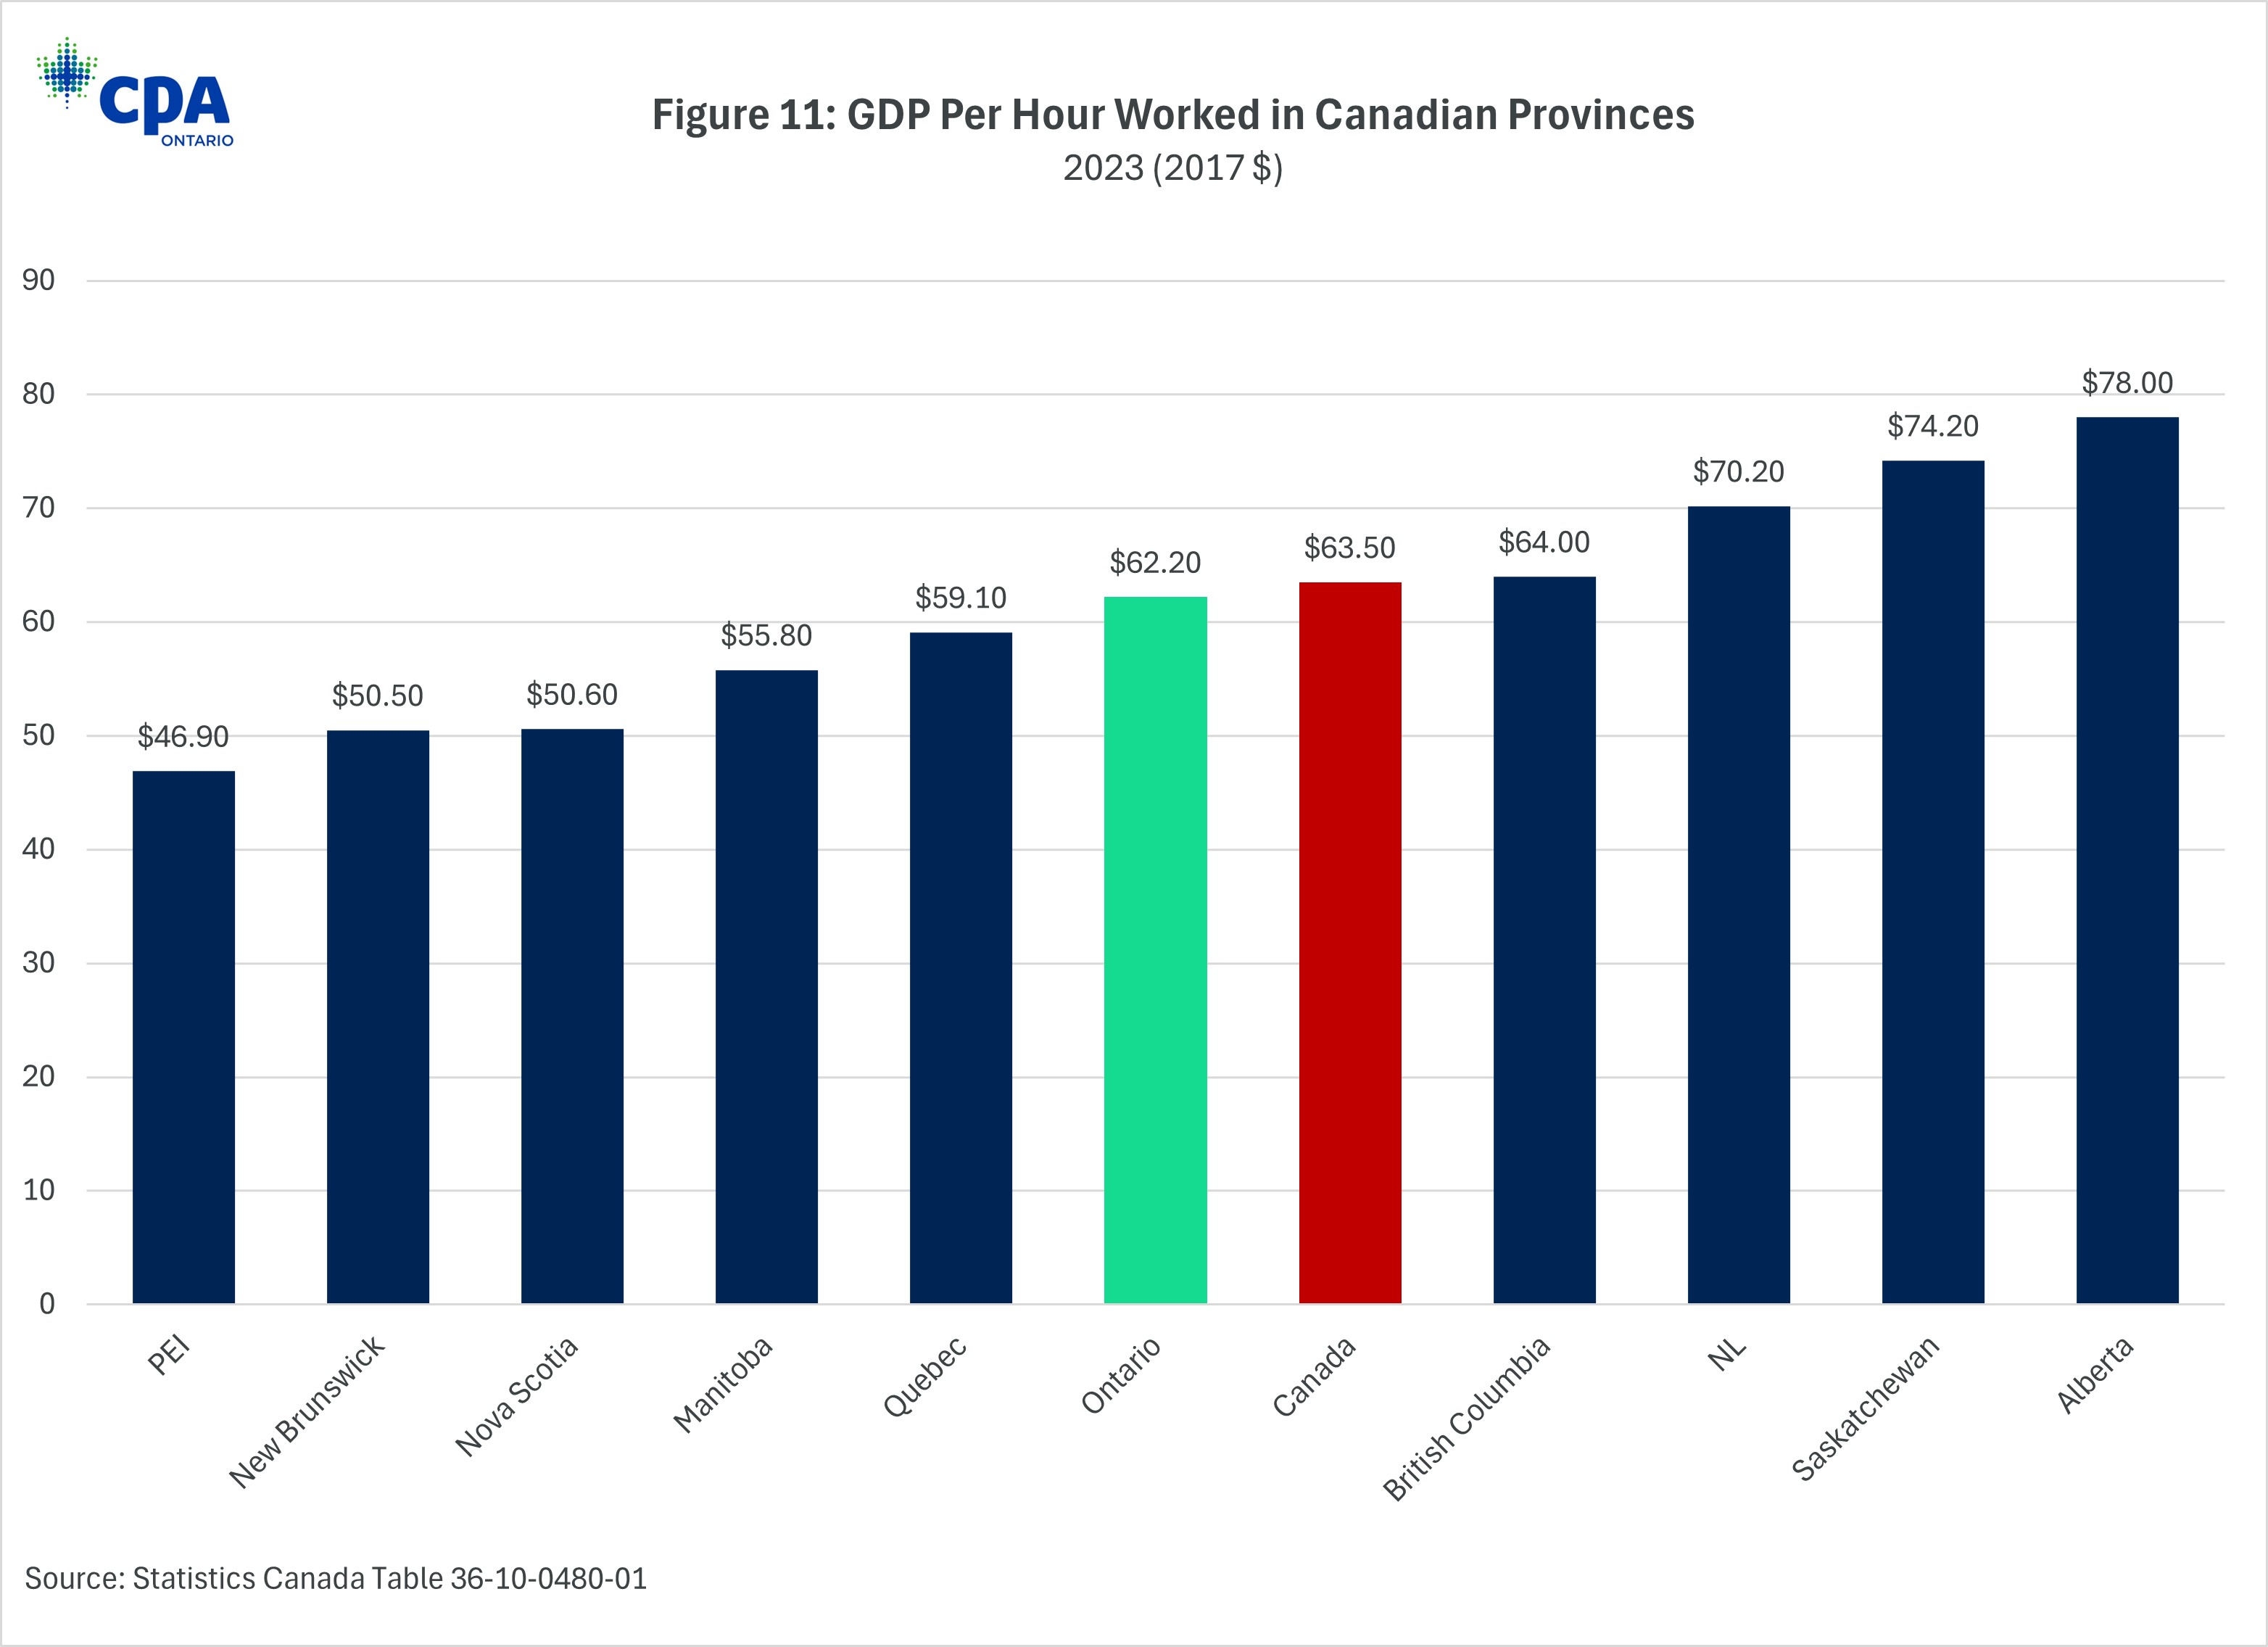
Figure 11: GDP Per Hour Worked in Canadian Provinces
Canada Is Not Investing for growth
Capital investment, whether in machinery and equipment or intellectual property, fuels future economic growth. Strong capital investment positions companies to adopt new technologies while allowing workers to produce goods and services more efficiently. When comparing levels of investment between countries, a common measure to use is gross fixed capital formation (GCFC)[3] as a share of the economy. This measures the annual flow of investment and can be broken down into different types of investment to get a sense of where different economies are devoting their marginal investment dollars.
Figures 12a and 12b compare Canada’s recent record on business investment (i.e. non-residential investment) spending and housing investment (i.e. residential investment)[4] against 16 other OECD countries for which there is comparable data. When looking at investment in housing, Canada devoted the highest share of its economy to housing investment, on average, from 2010 to 2023 (Figure 12a). This matters because this focus on housing diverts investment dollars from more productive sectors of the economy. By comparison, business investment, which is generally the type of investment that can enhance productivity, Canada ranked 13th out of 17 as shown in Figure 12b. Put simply, Canada is over investing in housing and under investing in the things that will grow the productive capacity of the economy.
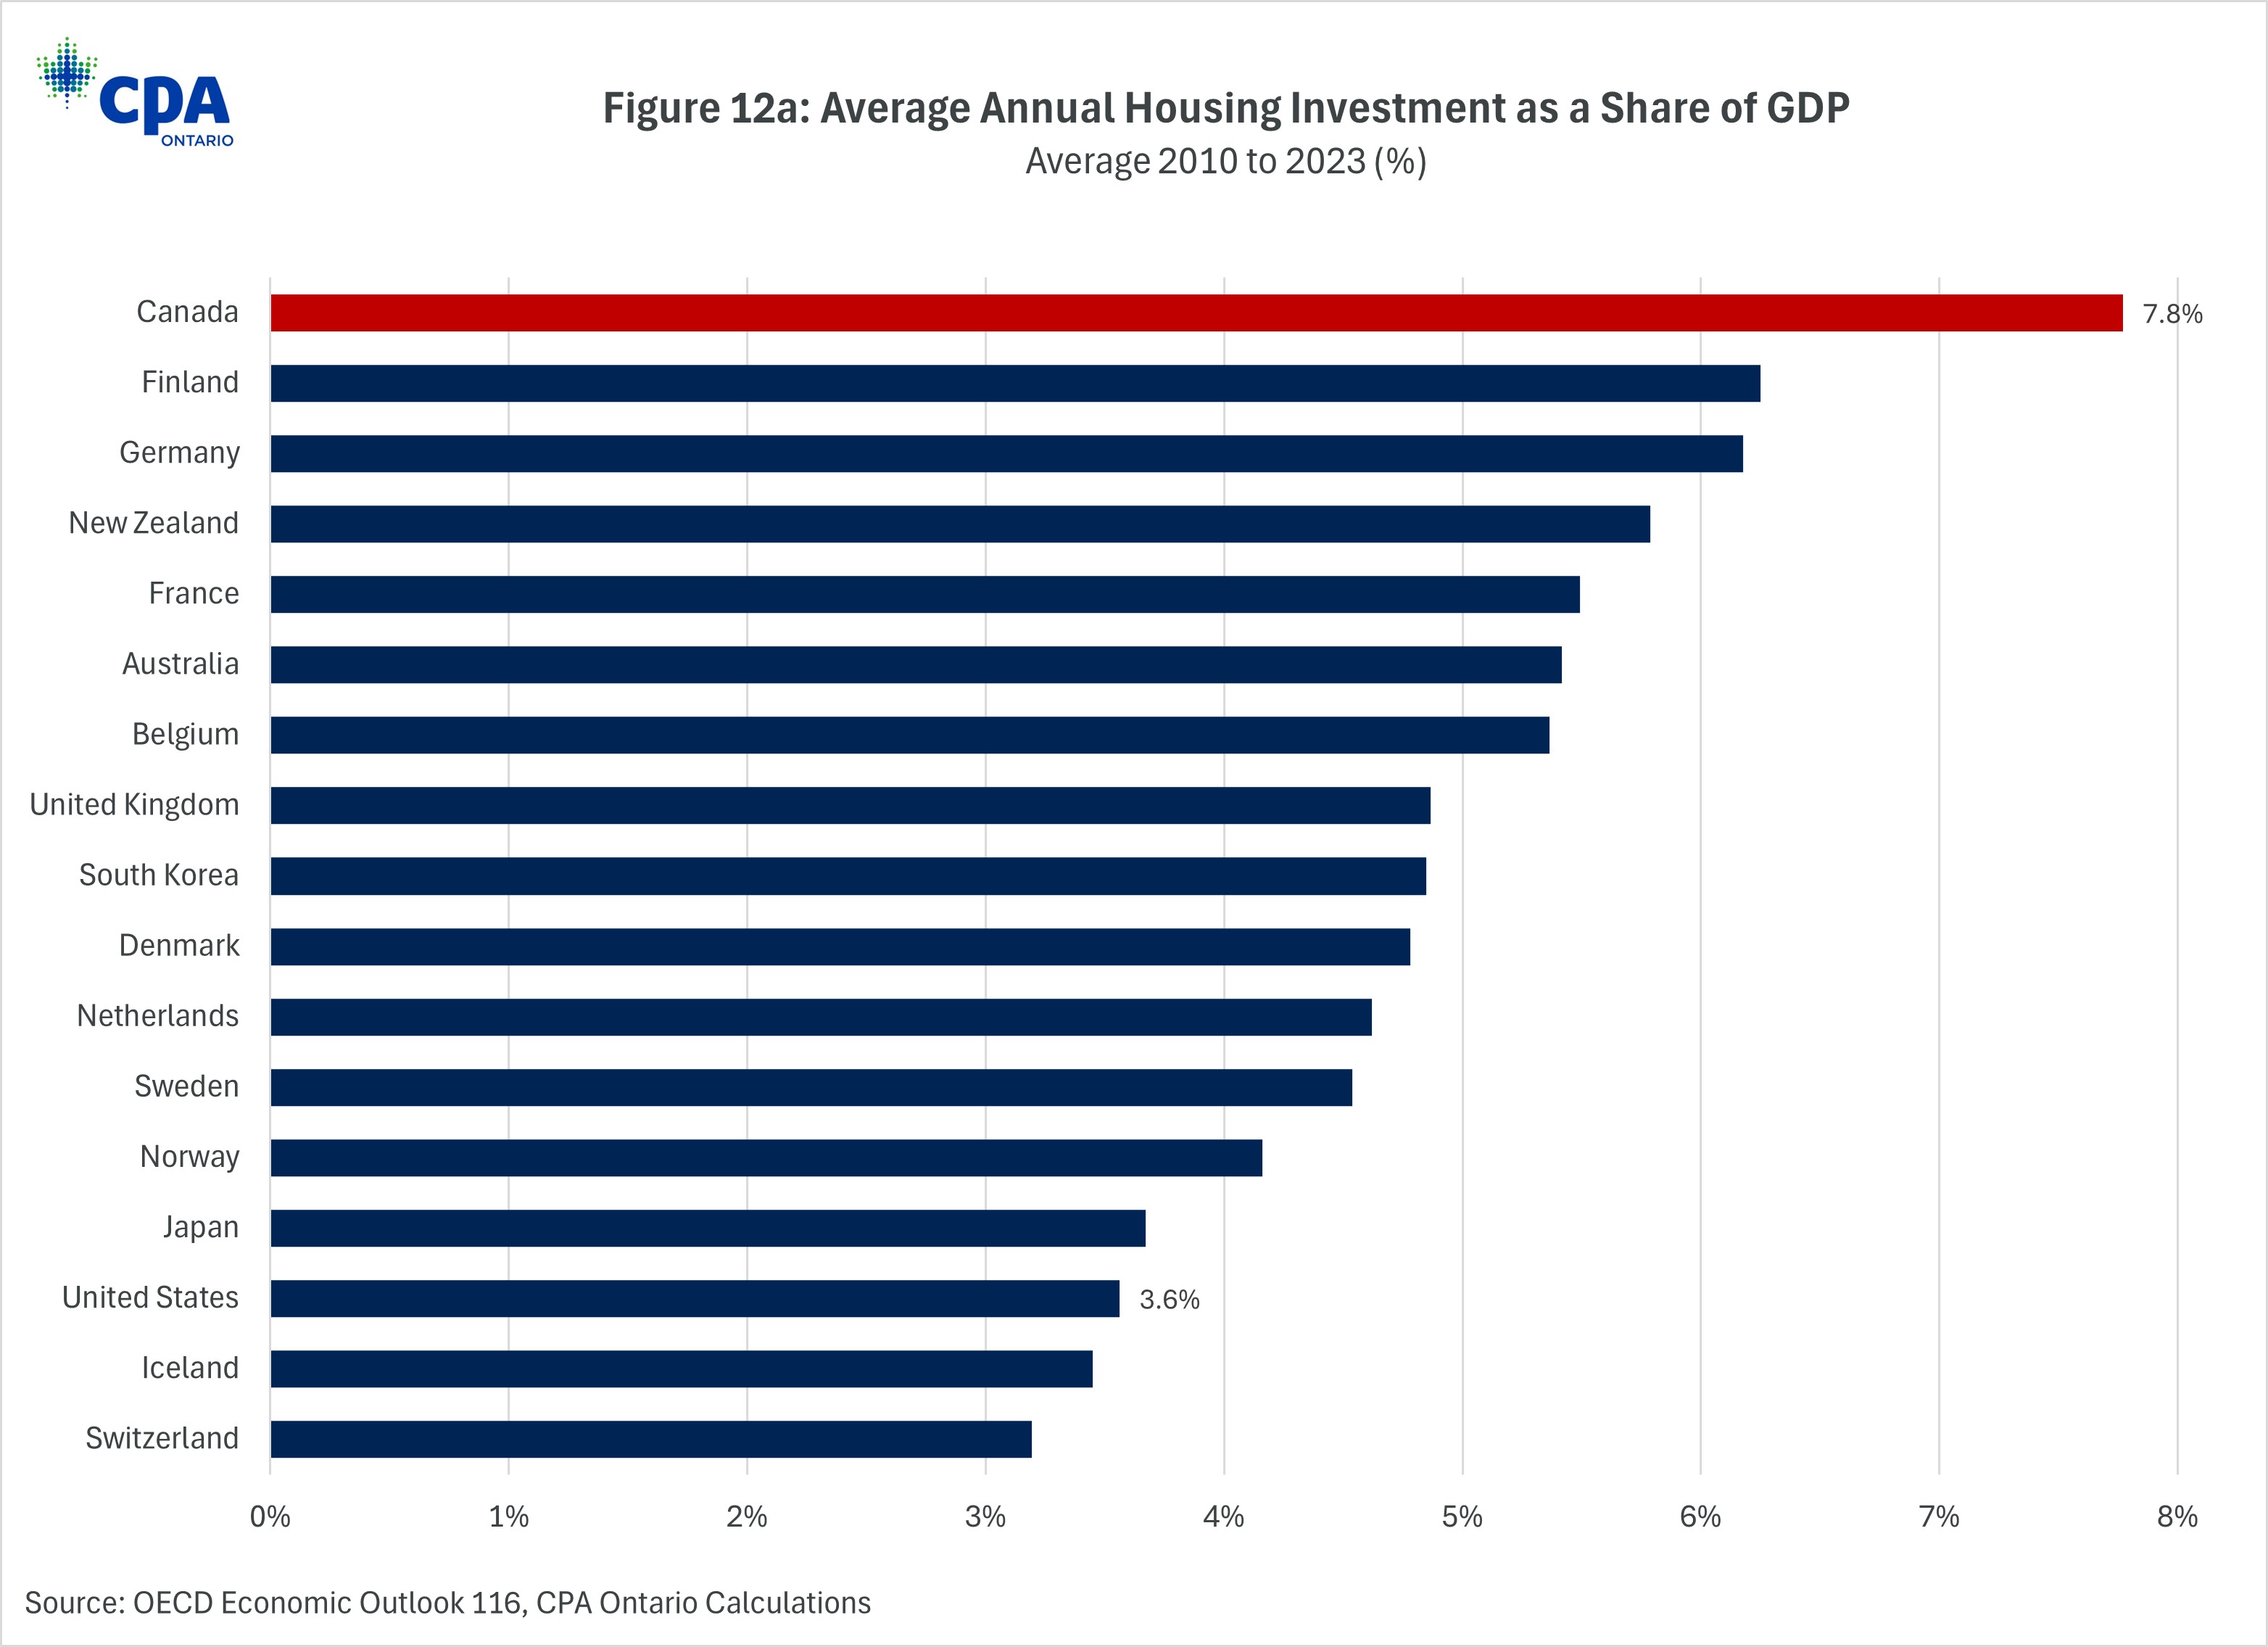
Figure 12a: Average Annual Housing Investment as a Share of GDP
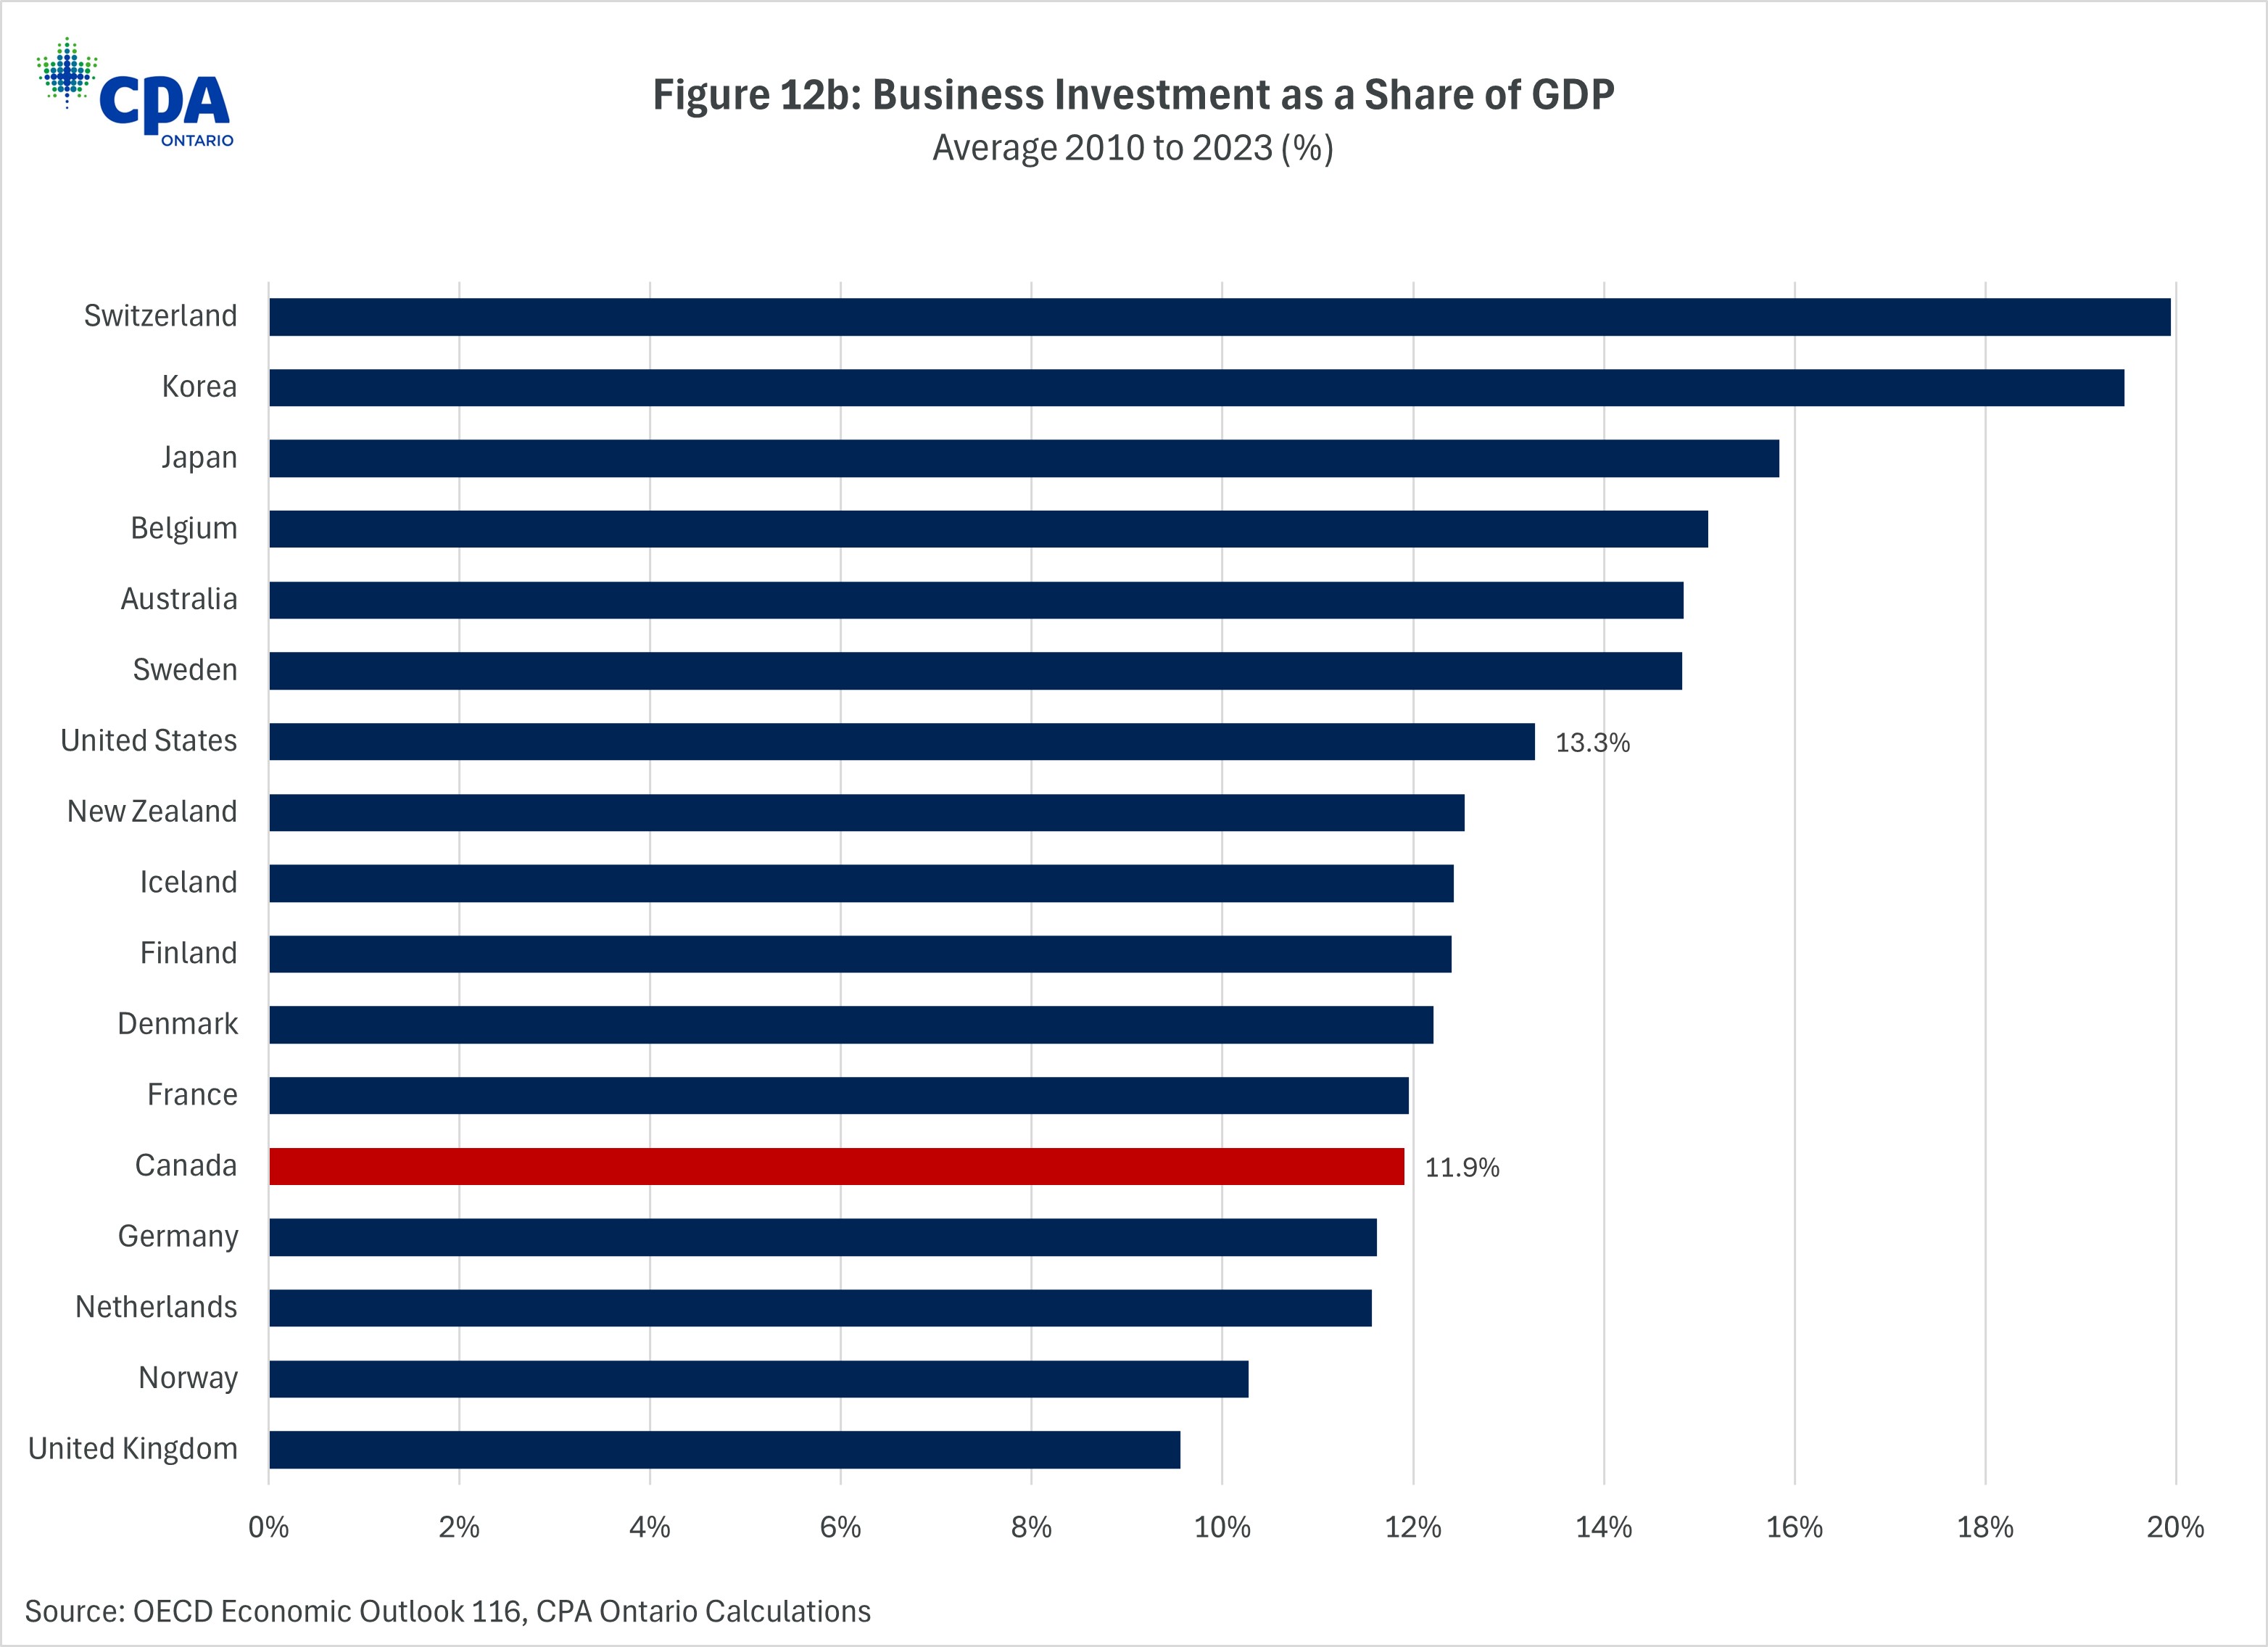
Figure 12b: Business Investment as a Share of GDP
When considering business investment exclusively, comparisons between Canada and the U.S. are even starker (see Figure 13). Prior to 2015, Canada was devoting a higher share of its economic output to business investment than the U.S. Since 2017, Canada’s share has essentially flatlined while the U.S. is devoting a growing share. In Q3 2024, business investment in the U.S. was 15.1% of GDP compared to only 10.9% in Canada.
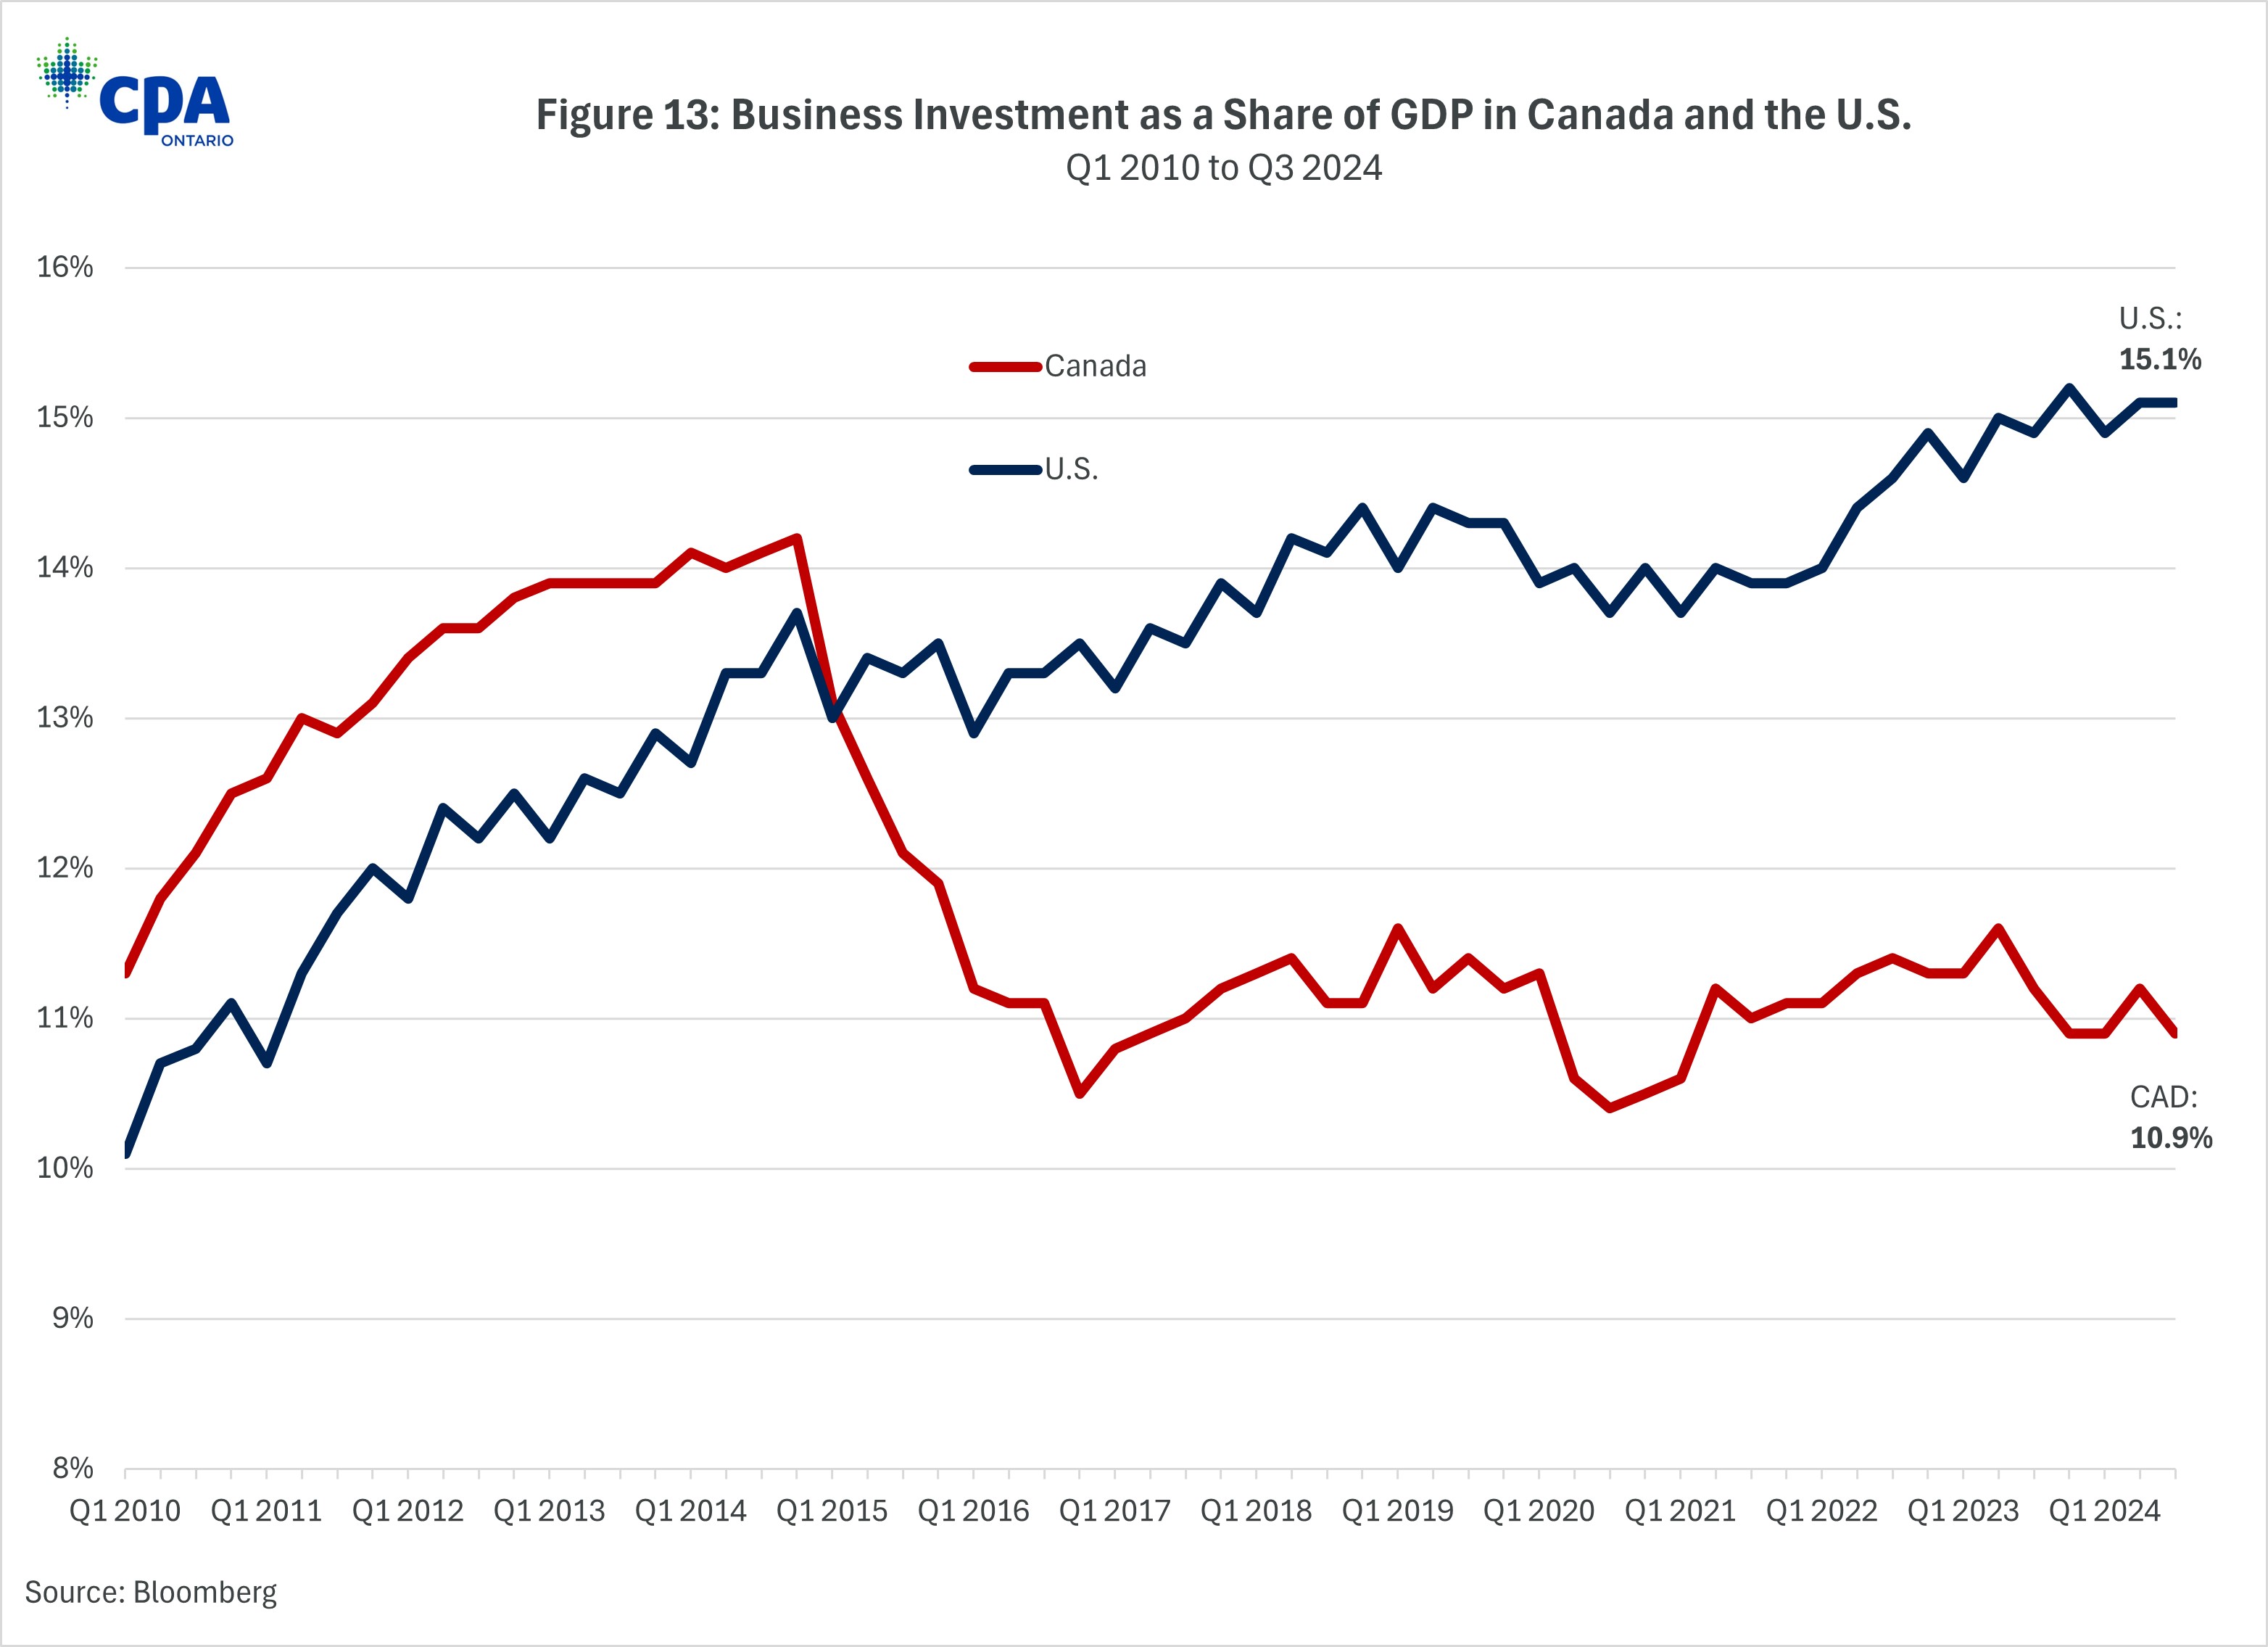
Figure 13: Business Investment as a Share of GDP in Canada and the U.S.
The investment challenge for Canada relative to the U.S. is even more striking when looking at the capital available to workers in Figure 14. This comparison is key because it captures capital differences on a per worker basis, rather than relative to the overall economy. Prior to 2015, before commodity prices dropped, investment per worker in Canada was around 90% of what it was in the U.S. Fast forward to Q4 2023, investment per worker in Canada is now less than 50% of what it is in the U.S. This means Canadian workers have significantly less capital available to be more productive, raise their wages, and grow the economy, when compared to the capital available to American workers.
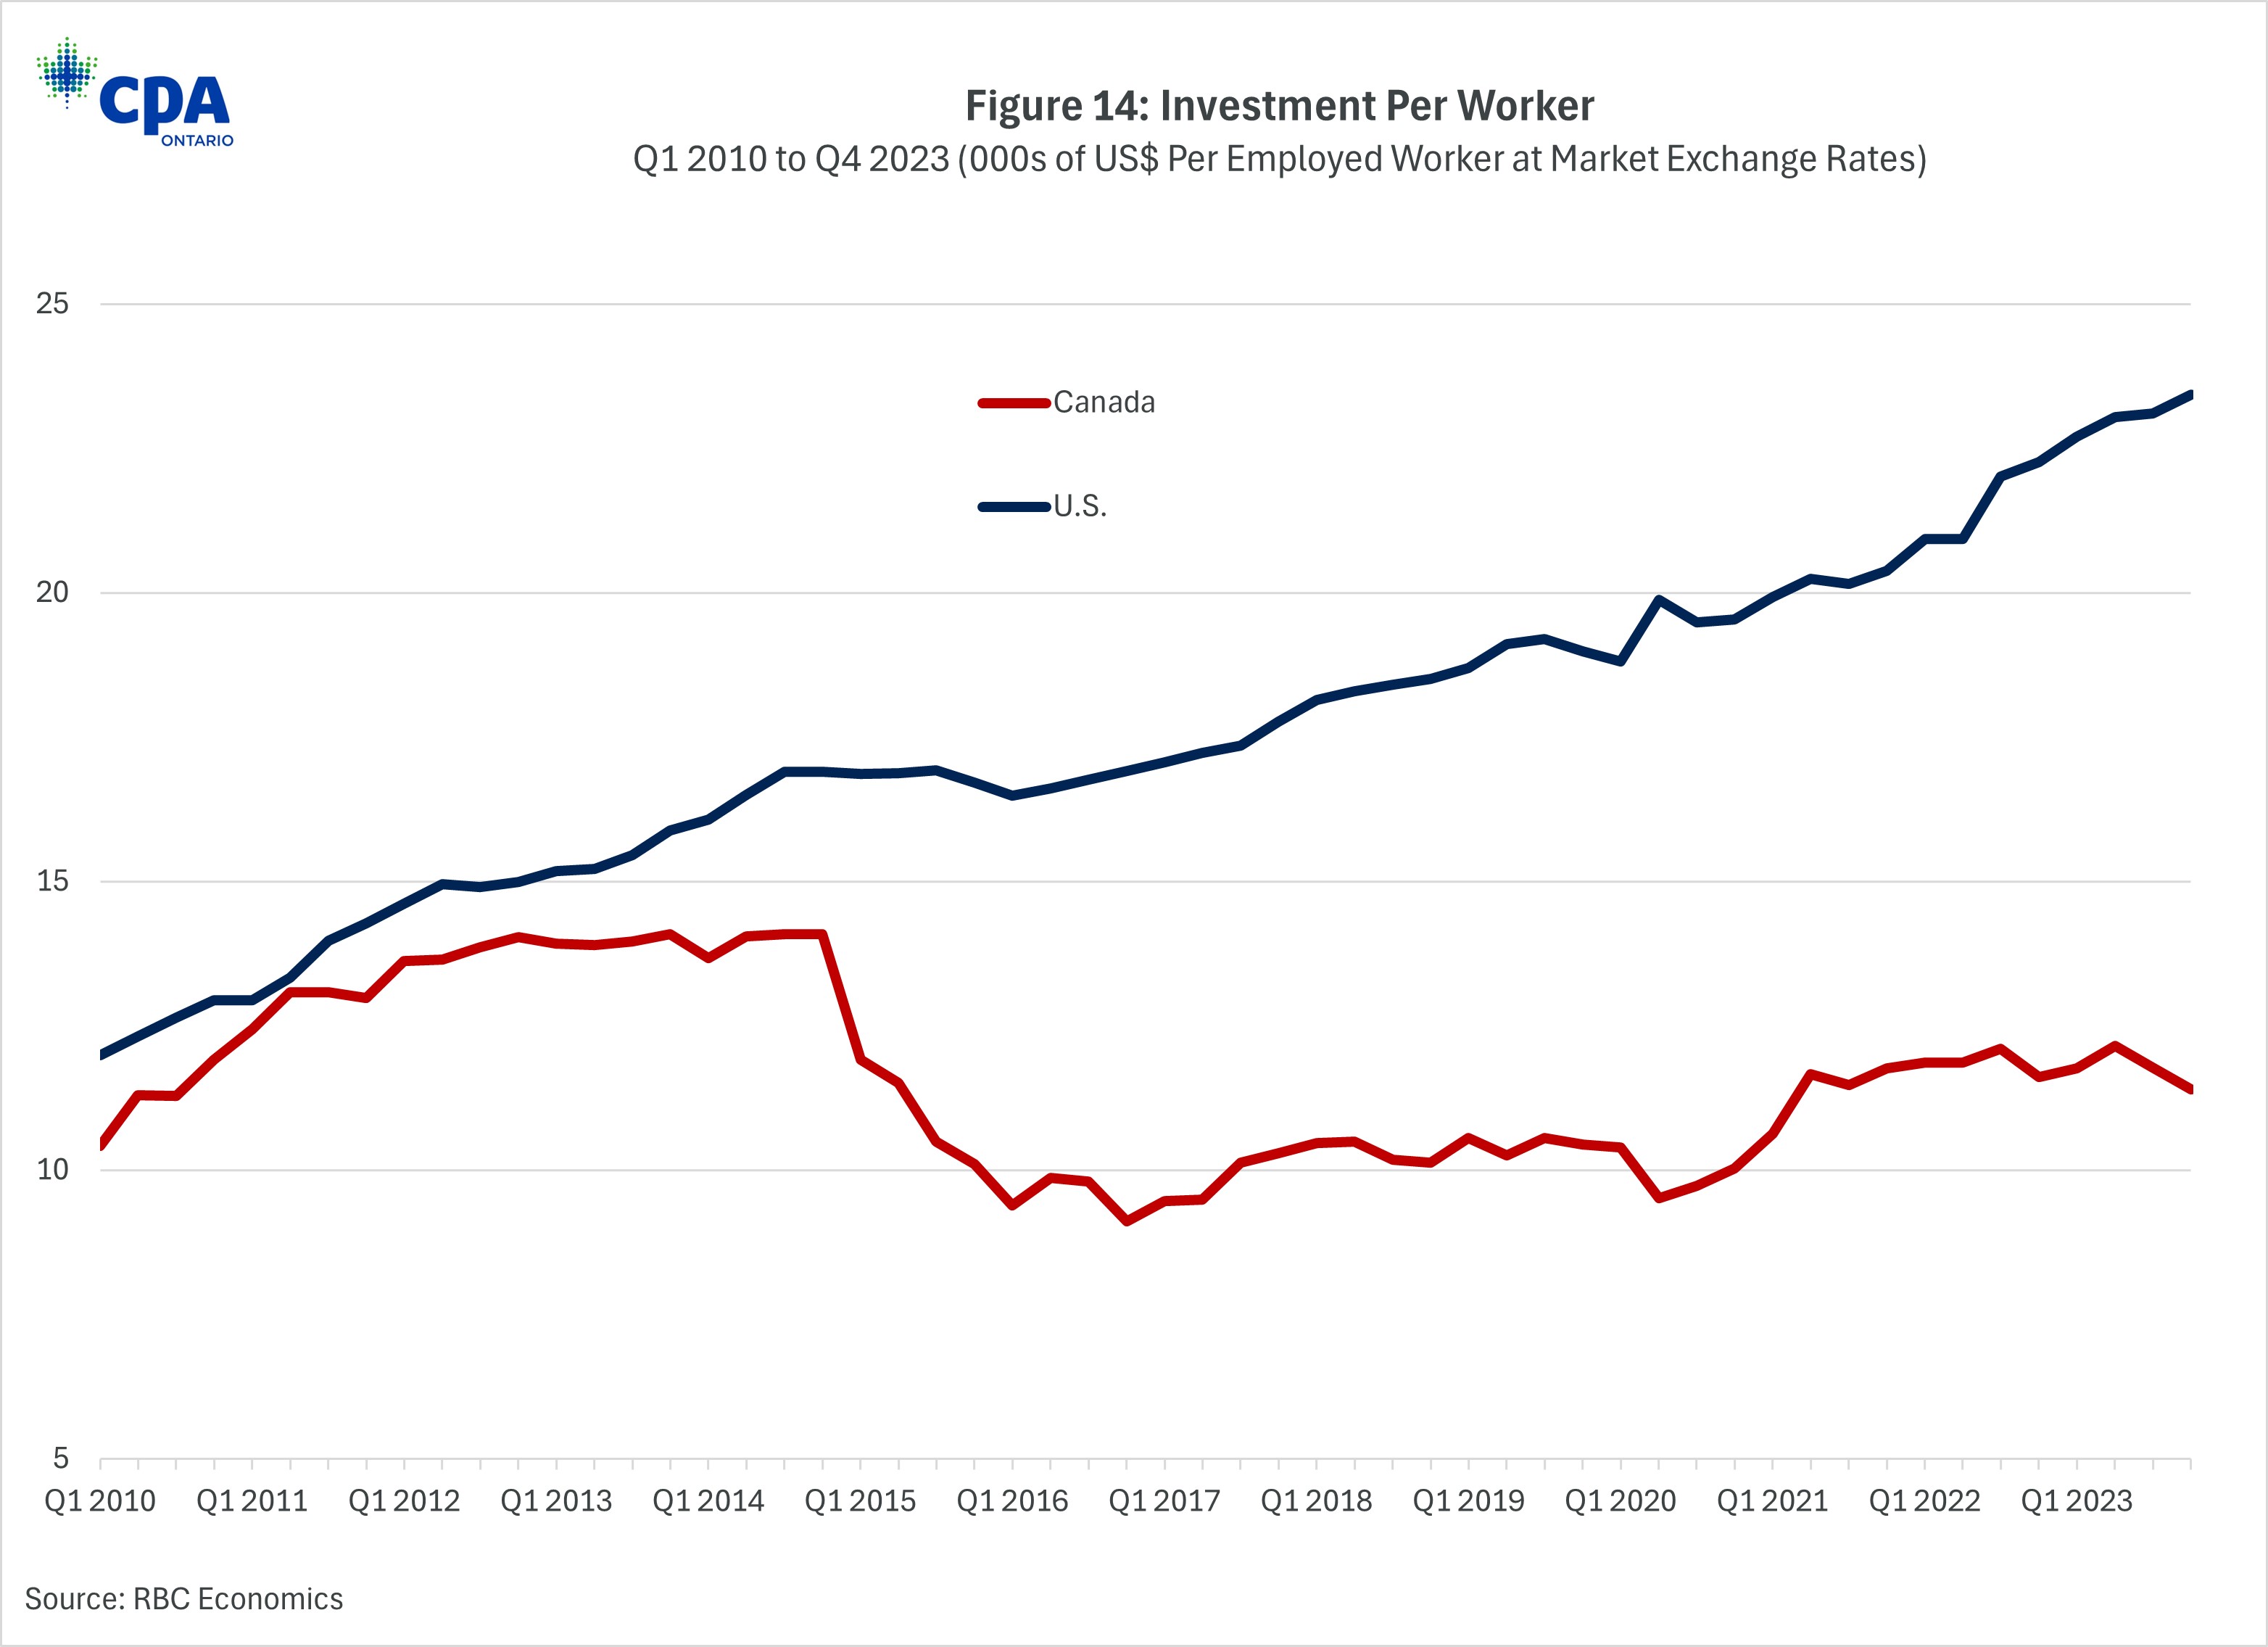
Figure 14: Investment Per Worker
Consider the non-residential capital stock per worker in Canada and Ontario. The capital stock represents the total value of assets adjusted for depreciation, while business investment refers to the annual expenditure on new assets. Capital stock per worker is a crucial measure for productivity growth as it indicates the total amount of capital available to workers. Figure 15 shows the inflation-adjusted capital stock per worker by type for Canada, with 2015 as the index value of 100. It reveals that the total non-residential capital stock per worker peaked in 2015 and has steadily declined through 2023. While all levels of the capital stock per worker are significantly below their 2015 levels, it is notable that the machinery and equipment capital stock per worker decreased by 15% from 2015 to 2023.
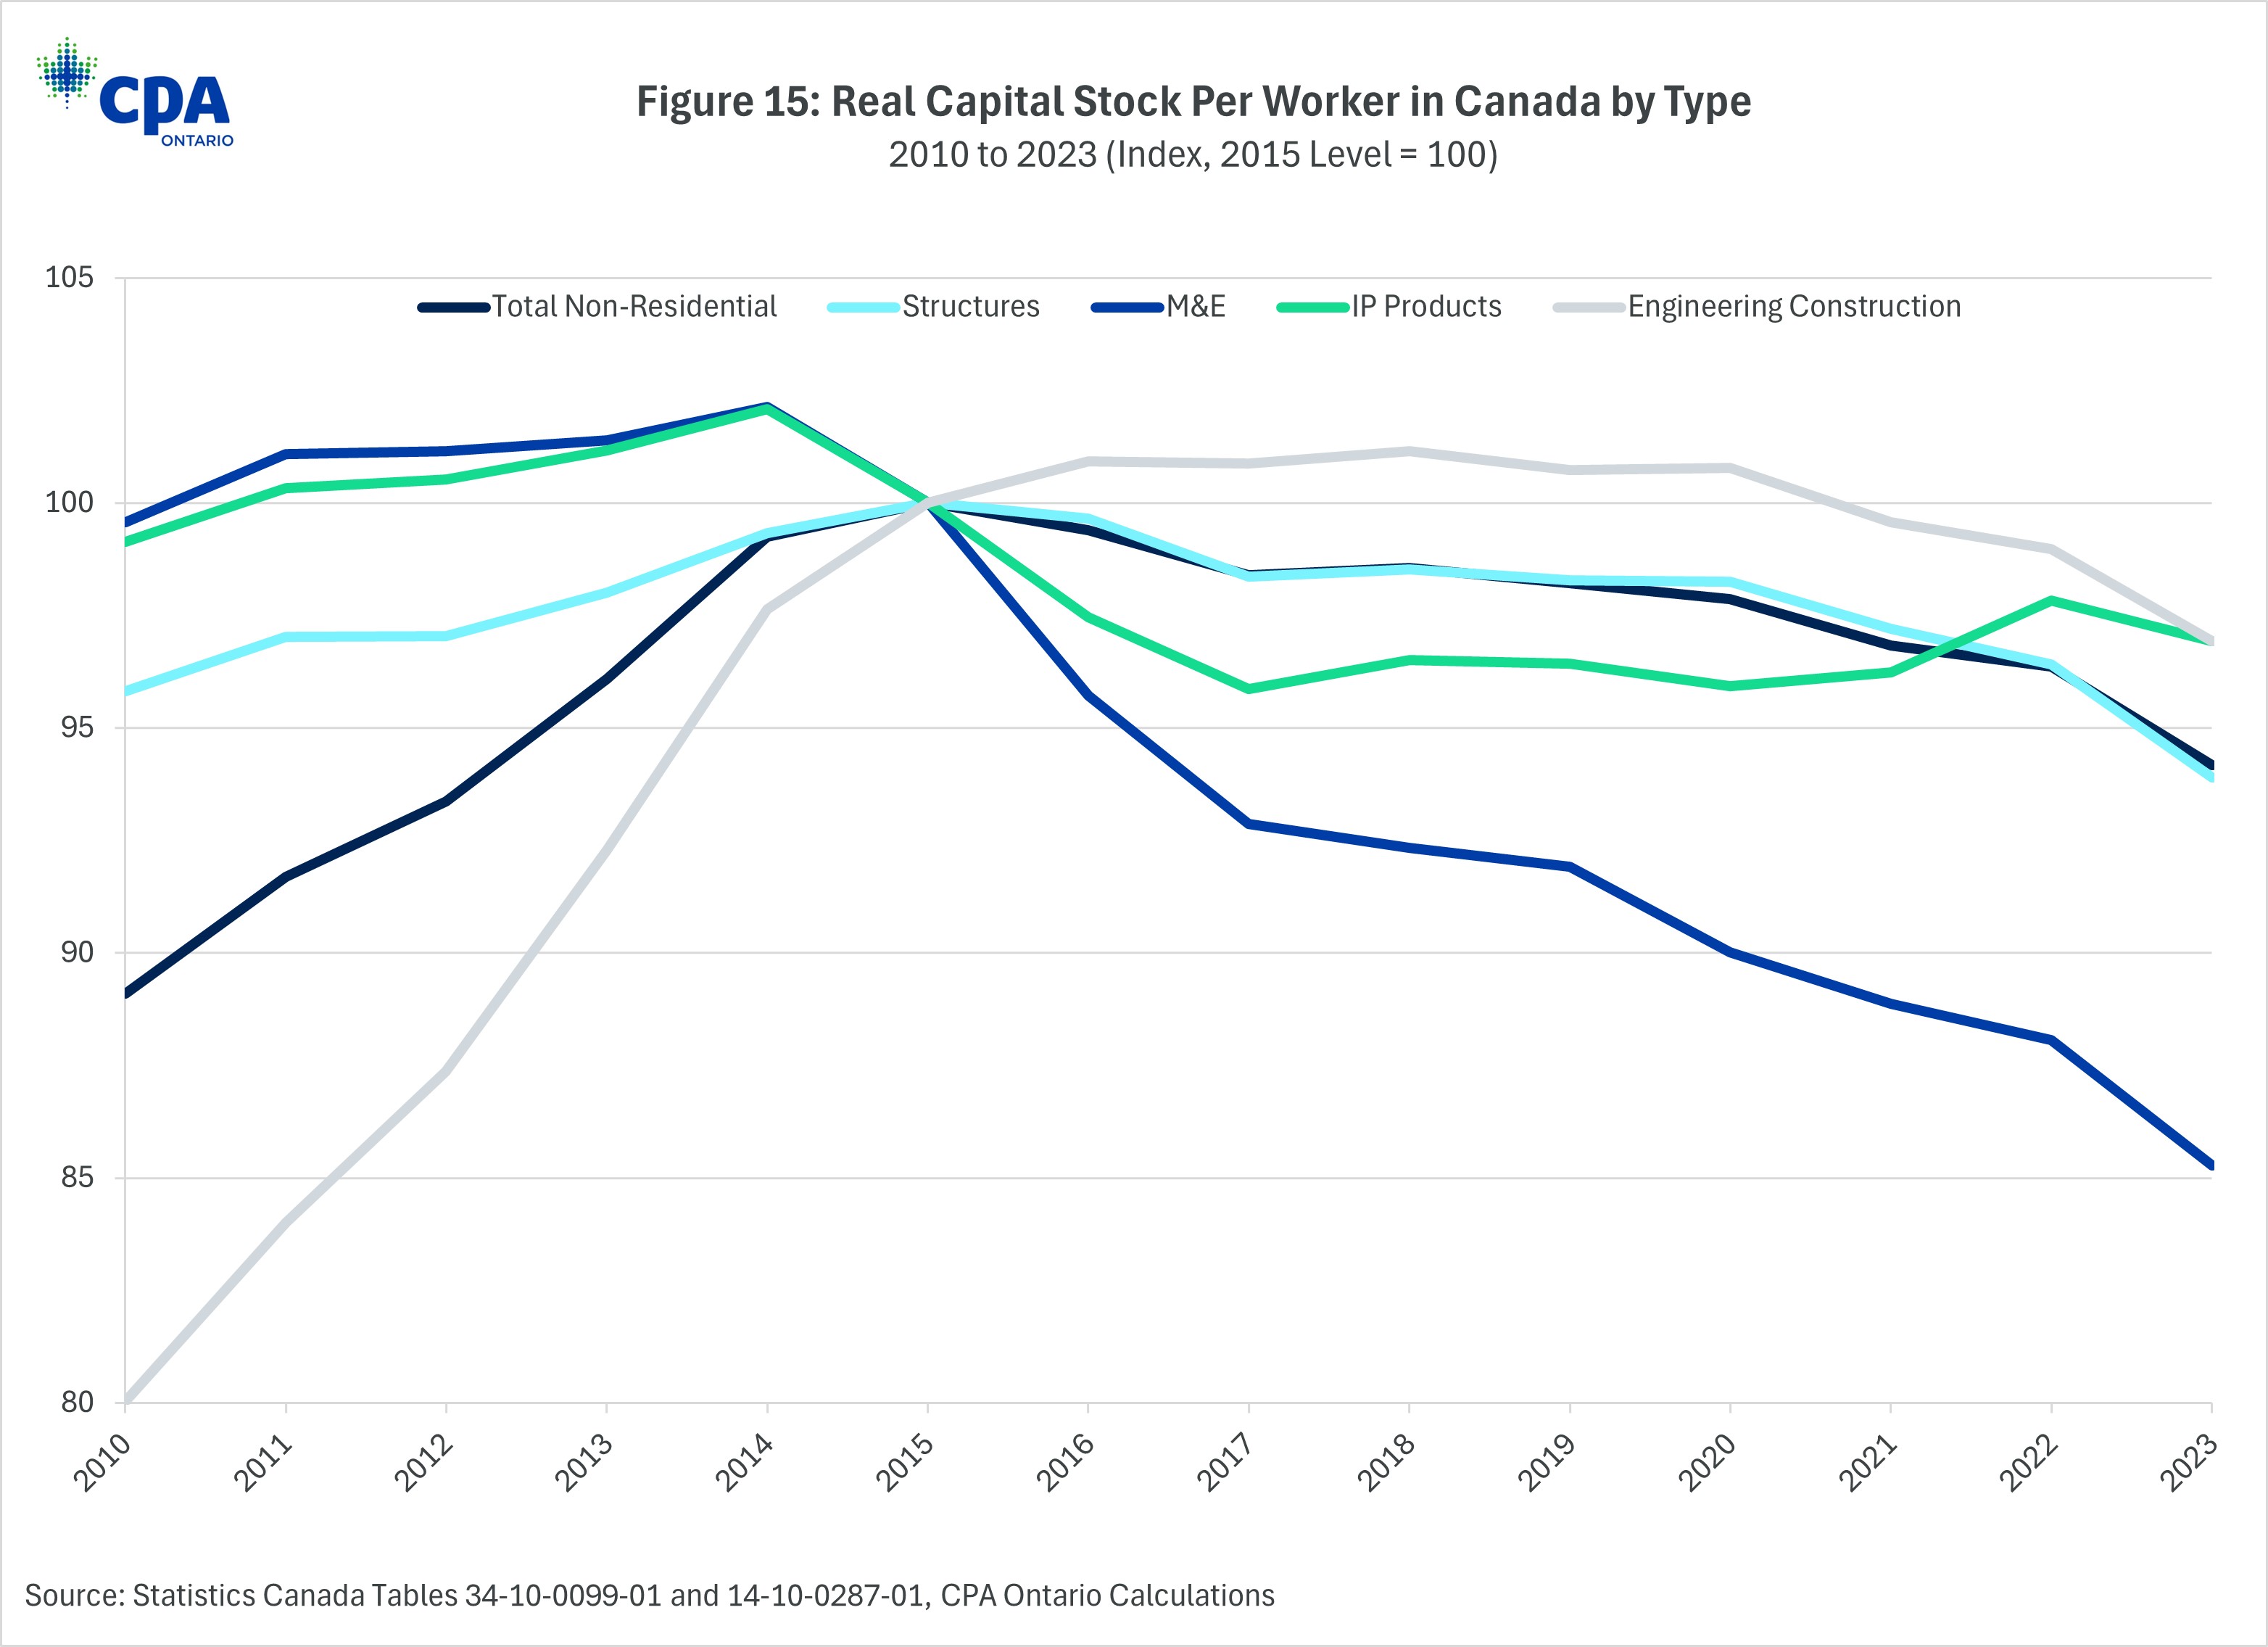
Figure 15: Real Capital Stock Per Worker in Canada by Type
In Ontario, the stock of total non-residential capital per worker is also lower in 2023 than in 2015 including a significant drop in machinery and equipment capital per worker of 12% (Figure 16). A bright spot for Ontario is that the capital stocks of engineering construction and IP products per worker have grown since 2015, despite the decline nationally. However, these increases in the capital stock per worker are not enough to offset the overall decline in non-residential capital stock.
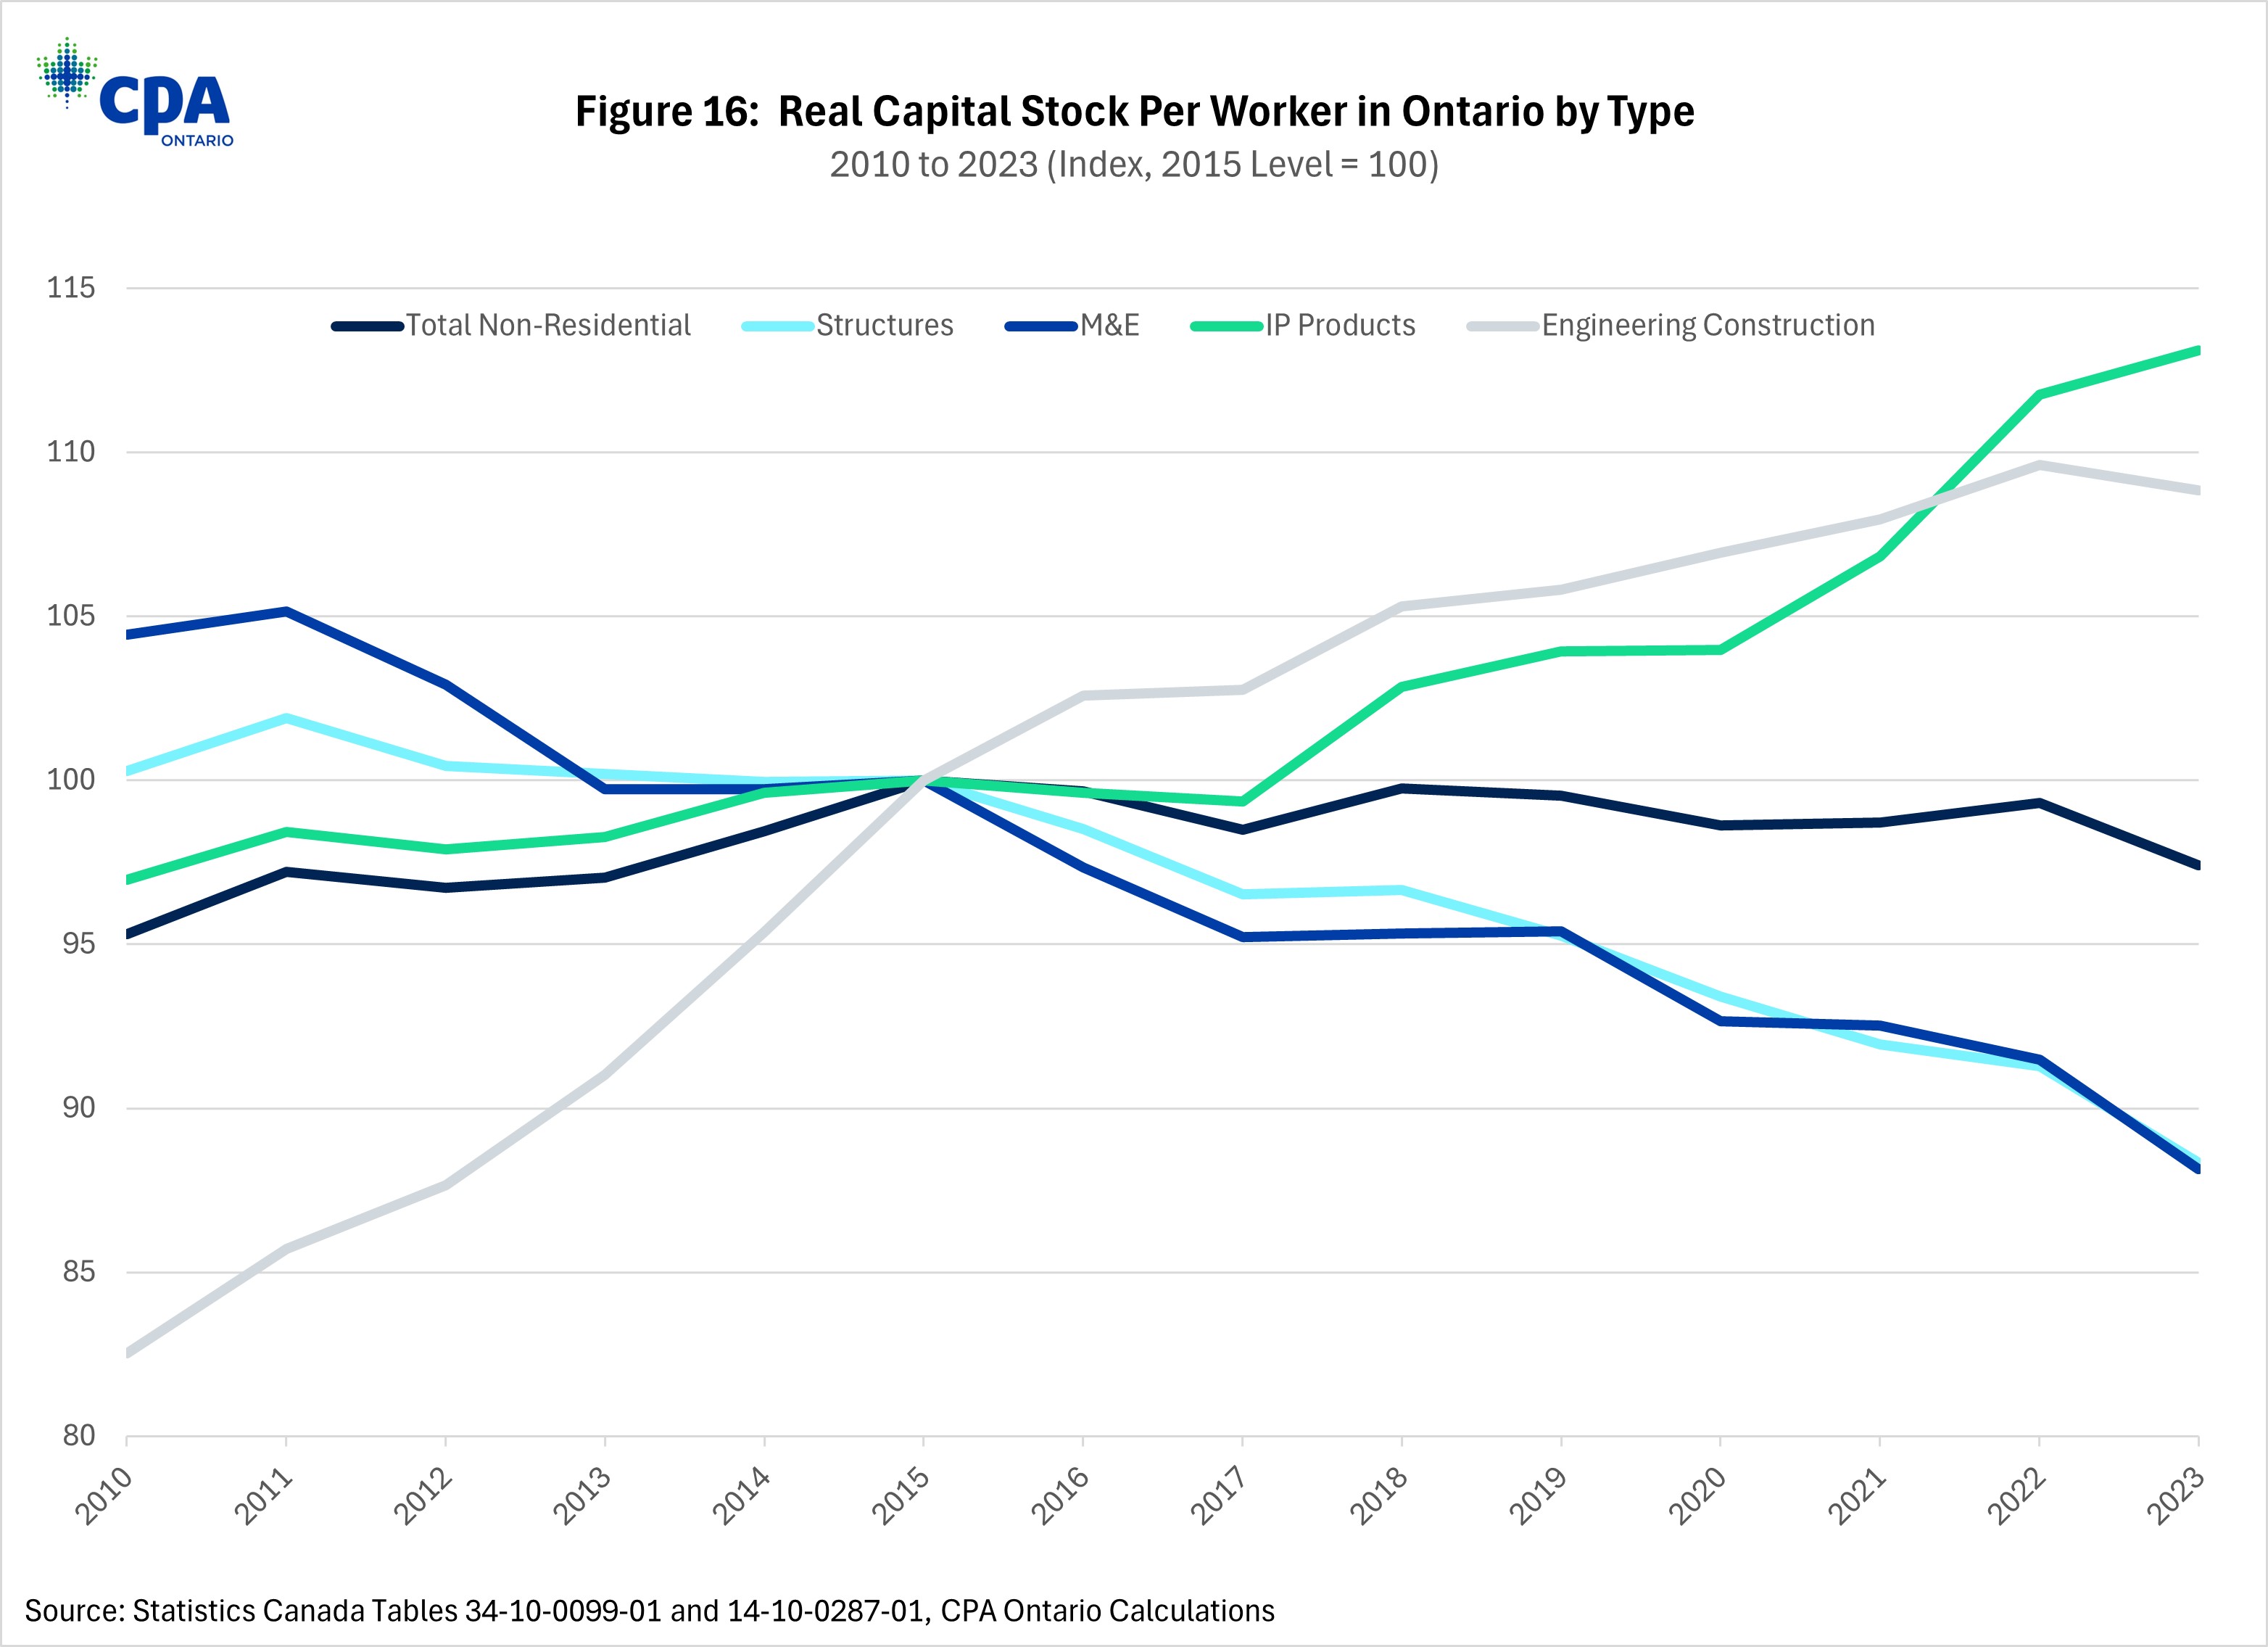
Figure 16: Real Capital Stock Per Worker in Ontario by Type
Investments in innovation and intangibles are crucial sources of economic growth, as economies continue to evolve from traditional forms of production to knowledge-based sectors. On this front, Canada, unfortunately, is at best a middling performer internationally.
Consider patent applications, which represent the formal recognition of new inventions and technological advancements; they provide a useful, although imperfect, measure of inventive activity across different regions. High numbers of patent filings typically indicate robust research and development (R&D) efforts, which are essential for driving technological progress and economic growth. Figure 17 shows that when it comes to patent applications per million people, at 123 Canada is in the middle of the pack among other advanced nations—significantly behind the U.S. (778) and patent leaders South Korea (3,593) and Japan (1,785).
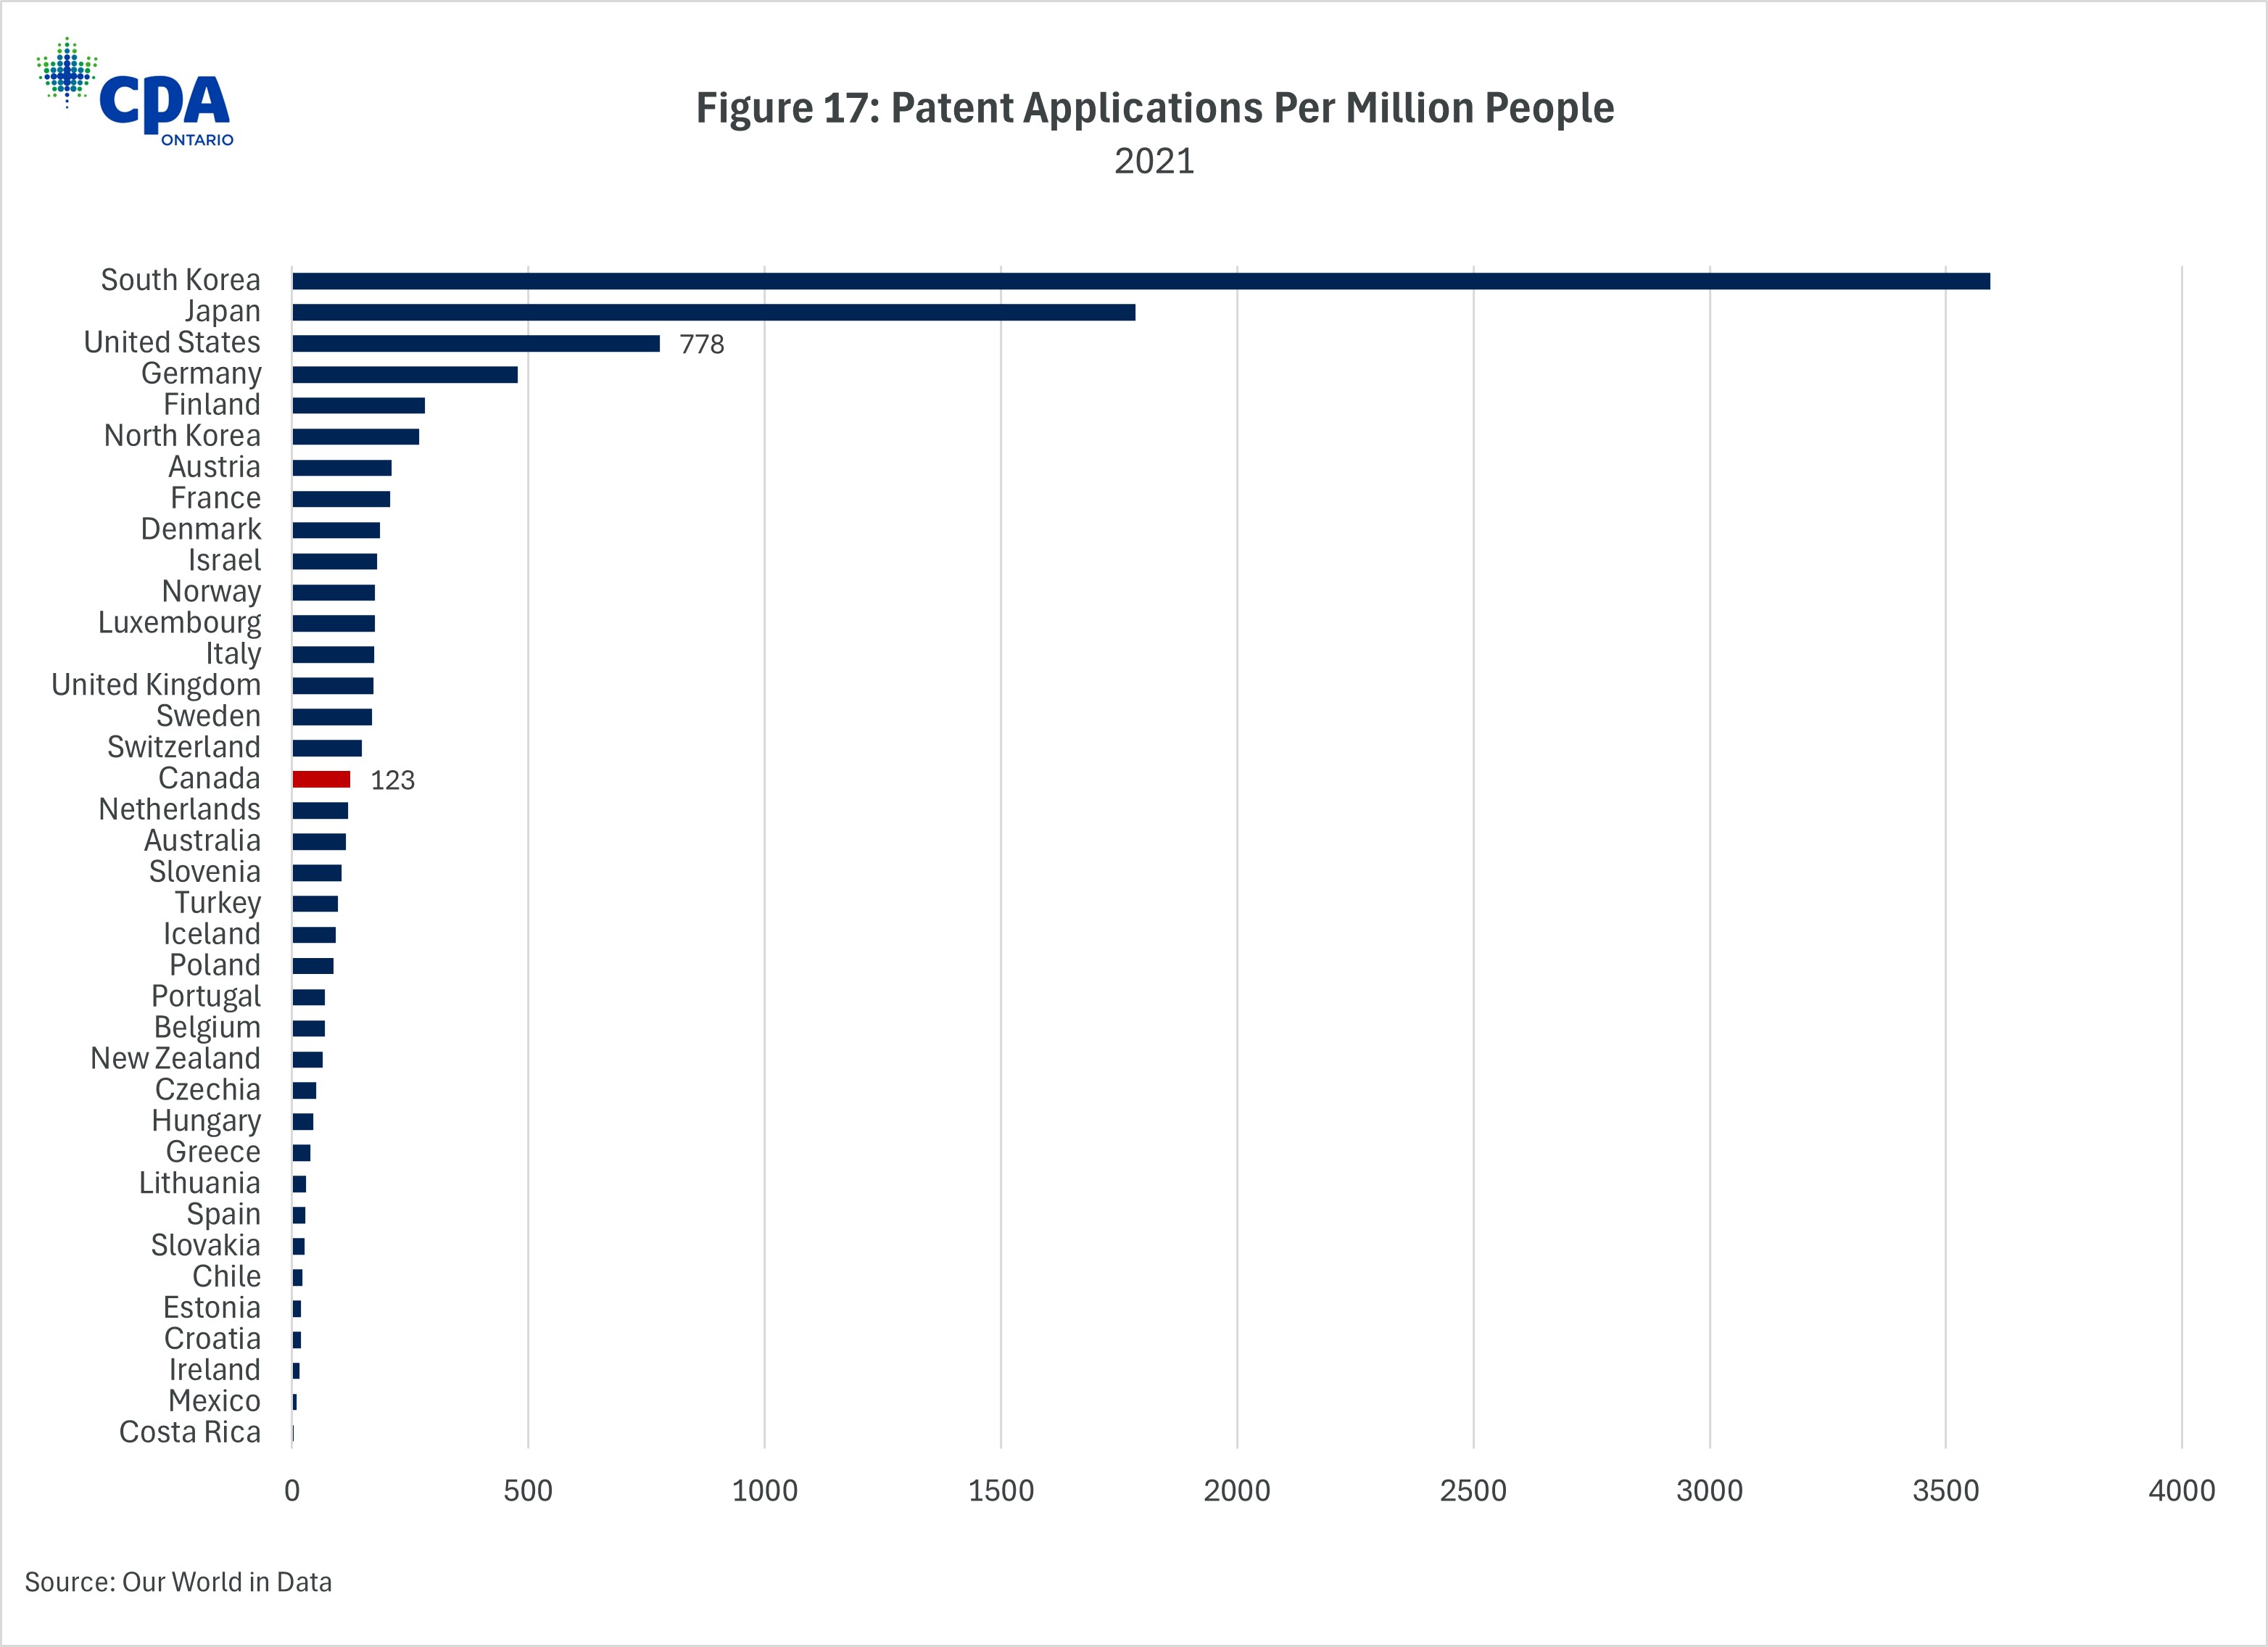
Figure 17: Patent Applications Per Million People
Similar to patents, a country’s investment in information and communications technology (ICT) is a crucial driver of economic growth and productivity, as it enhances digital infrastructure, fosters innovation, and supports the development of new technologies. High levels of ICT investment in things like information and communication equipment and computer software and databases, indicate a commitment to advancing technological capabilities and improving efficiency and competitiveness. Here again, Canada is middling relative to OECD countries on ICT investment as a share of GDP (see Figure 18). On additional measures that drive digital innovation, including business investment in R&D, Canada underperforms compared to peer nations.
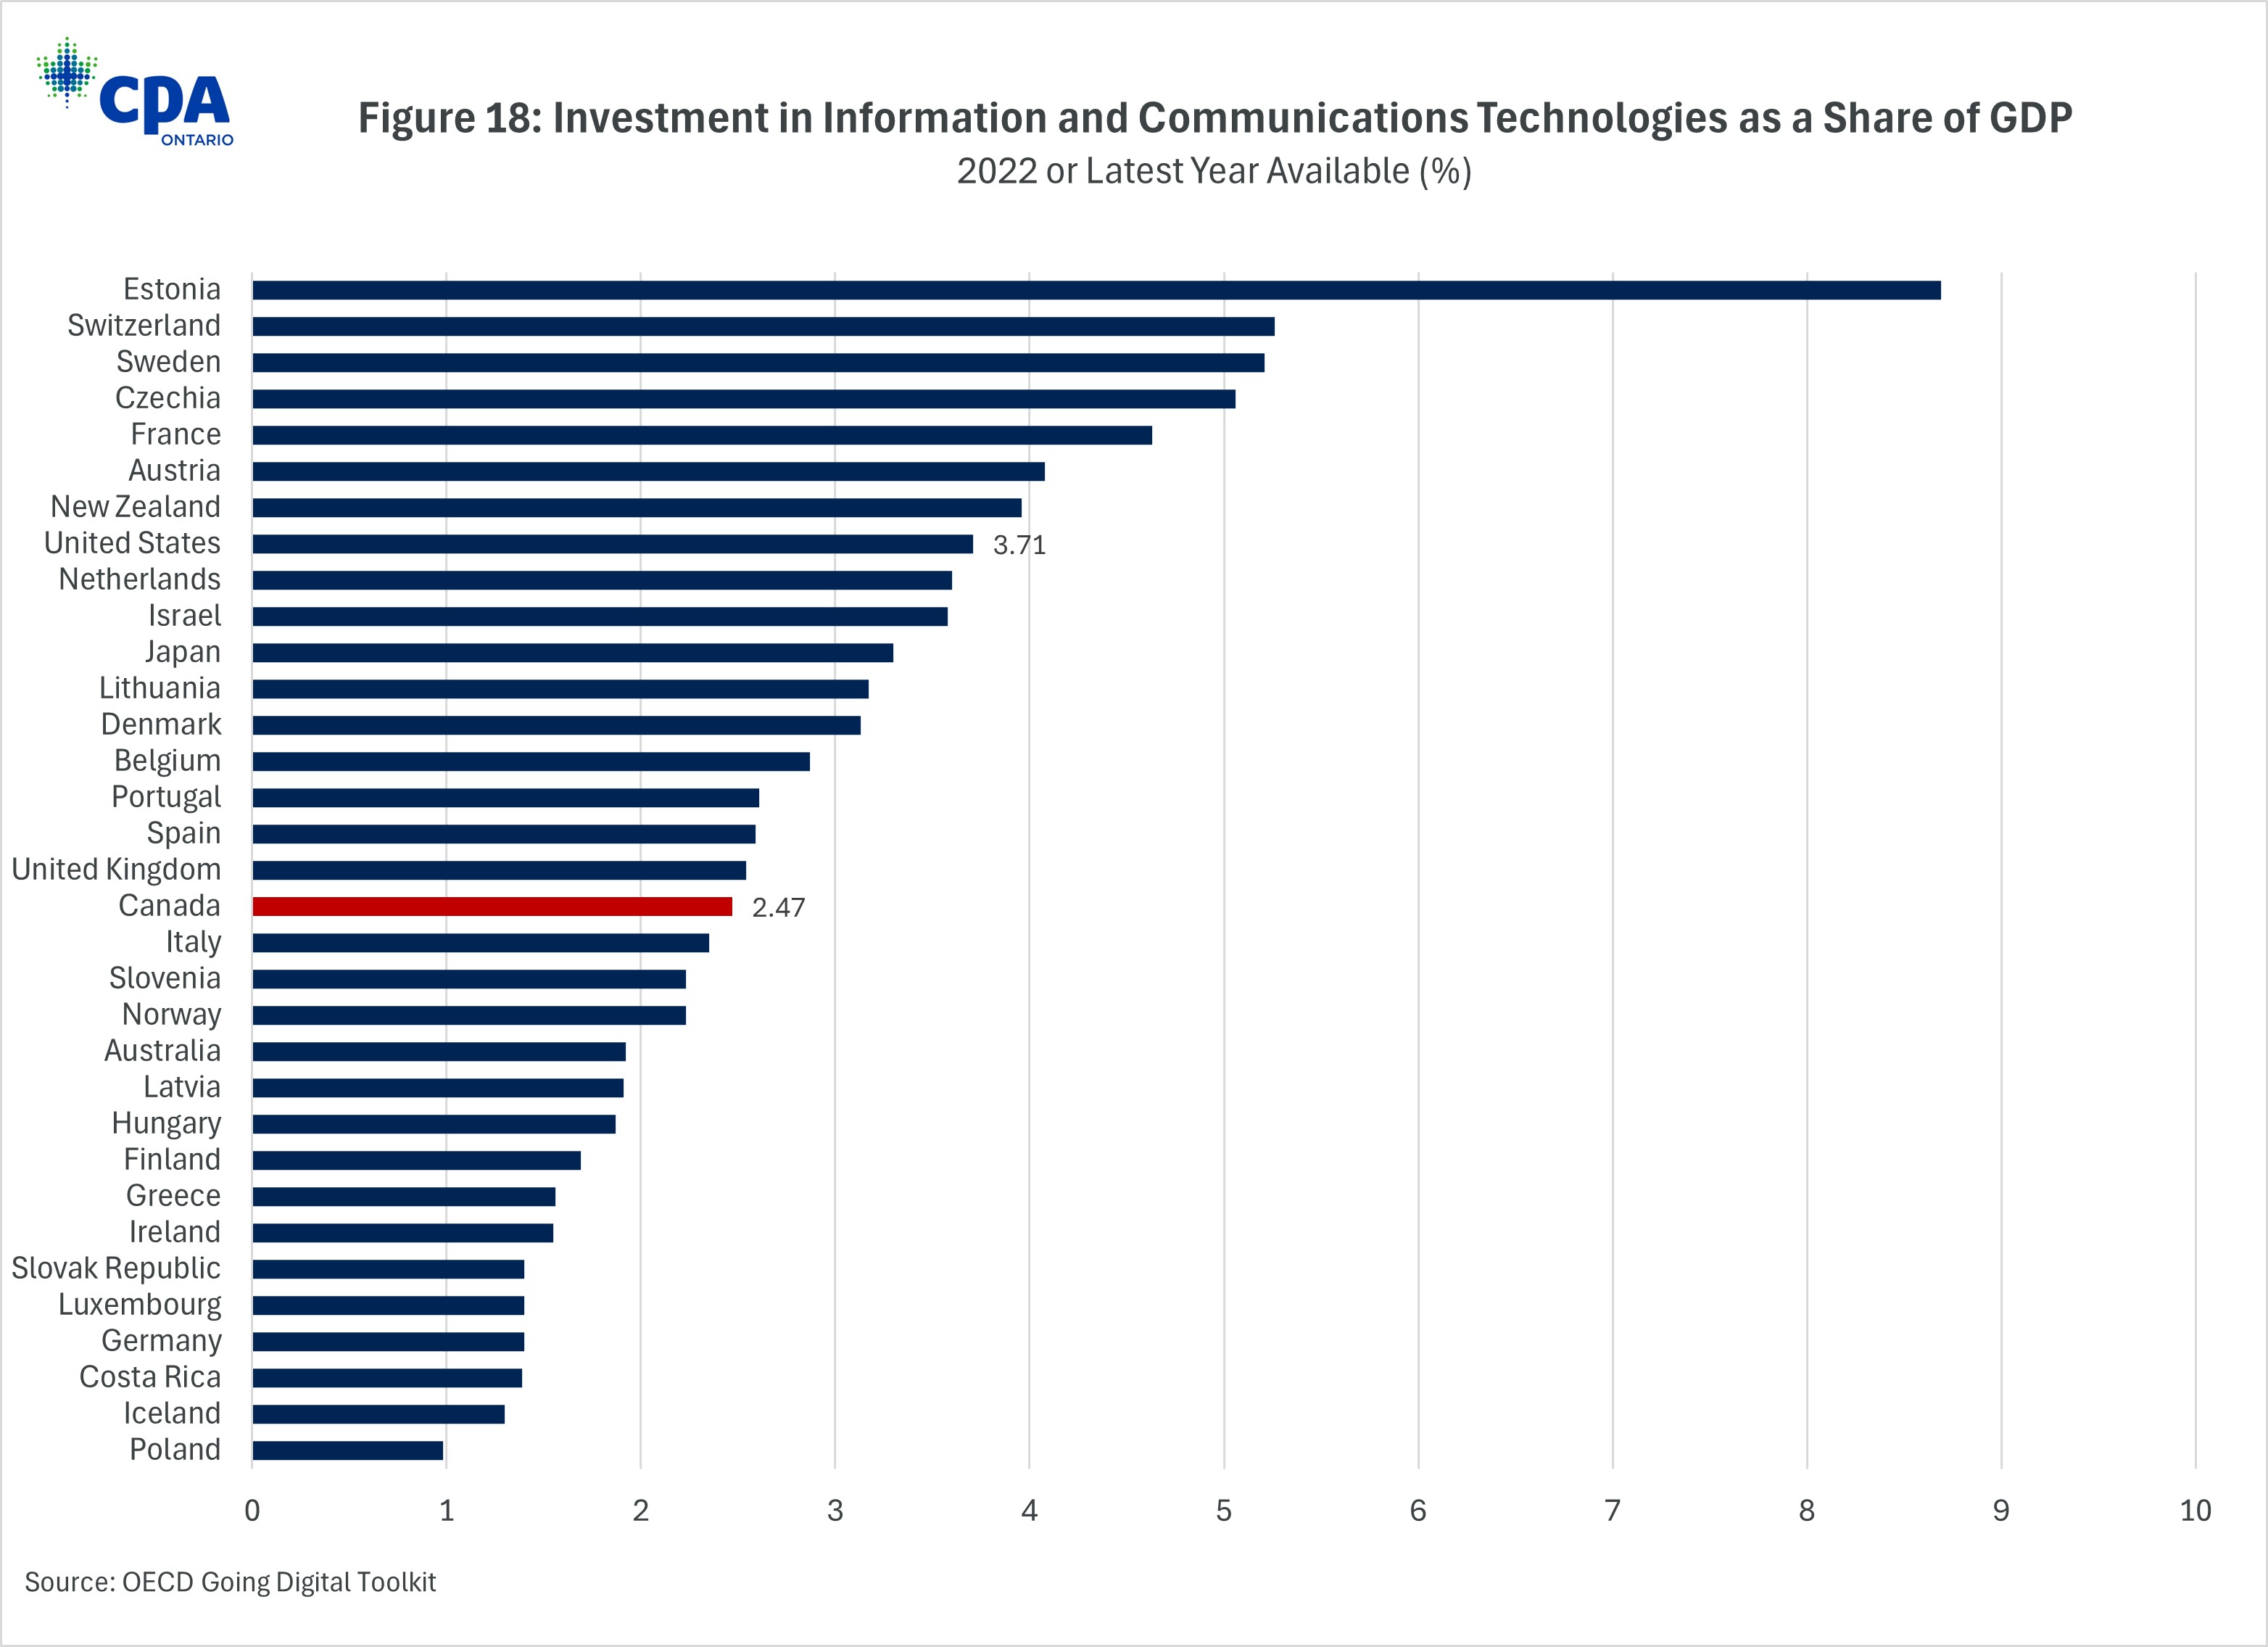
Figure 18: Investment in Information and Communications Technologies as a Share of GDP
Overall, Canada is facing significant economic headwinds. Investment in the types of capital and innovation that drive robust economic growth is faltering relative to historical levels and relative to peer countries. Canada didn’t become a poor economic performer overnight. These issues have been brewing for over a decade, continuing to worsen over time.
Trump’s Presidency Will Exacerbate Canada’s Economic Challenges
Now, in the face of these longstanding challenges, a new threat has emerged—the return of Donald Trump to the White House—that magnifies the urgency for economic transformation.
The Trump administration has introduced profound chaos and uncertainty for Canada and the world, including two types of economic challenges. The first will hurt the Canadian economy directly and second will hurt Canada’s economic competitiveness vis-a-vis the U.S.
As of March 6th, at least five separate tariff threats have been levied against Canada. The first of Trump’s five separate tariff threats against Canada have come into force, and if multiple tariffs are applied at the same time, it has been implied that they would be stacked:
- February 1st, 2025—Through an Executive Order, the Trump administration announces a 25% tariff on goods, excluding energy, and a 10% tariff on energy imports. This was paused for 30 days and went into force at midnight on March 4.
- February 11th, 2025—The Trump Administration announces a 25% tariff on steel and aluminum imports through an Executive Order—expected to be implemented on March 12th 2025.
- February 13th, 2025—An Executive Order is released outlining a plan to impose reciprocal tariffs in response to countries that use value-added taxes, including Canada’s goods and services tax. This is expected to go into effect on April 2nd, 2025.
- February 18th, 2025—In a news conference, President Trump tells reporters that he has plans to implement a 25% tariff on automobiles, pharmaceuticals, and semiconductors.
- February 28th, 2025—President Trump orders a trade investigation into lumber imports.
- March 3rd, 2025—The Trump administration confirms that, as of March 4th, it is moving forward with the tariffs announced on February 1st, 2025 through an Executive Order.
- March 5th, 2025 — A White House spokesperson confirmed that a one-month tariff exemption would be given on any automobile products coming through the U.S.-Mexico-Canada agreement.
- March 6th, 2025 — U.S. Commerce Secretary Howard Lutnick confirmed that President Trump would pause 25% tariffs on all goods that comply with the rules of the USMCA/CUSMA trade agreement until April 2nd 2025.
American tariffs can influence the Canadian economy in many ways. For instance, they would reduce American demand for Canadian goods and, if Canada retaliates, result in higher prices for imported goods in Canada.
University of Toronto economist Joseph Steinberg estimates that a 25% tariff on goods (10% on energy) could lower Canada’s GDP by upwards of 1.62%, while University of Calgary economist Trevor Tombe estimates a 25% tariff could reduce Canada’s GDP by 2.6% or about $2,000 per person, causing a recession. Tombe also estimates that Canada could lose roughly 600,000 jobs and given the cross-border integration of the automotive manufacturing supply chain, Southern Ontario could be particularly hard hit.
Beyond the impact of tariffs, the Trump administration is expected to make the U.S. more economically competitive through efforts like deregulation and corporate income tax cuts. During President Trump’s first term, the 2017 Tax Cuts and Jobs Act lowered the federal corporate tax rate from 35% to 21%. In his second term, he proposes to lower it further to 15%. Comparing 2024 combined statutory corporate income tax rates in the G7, this proposed cut will bring down the U.S. corporate tax rate to the lowest in the G7, more than six points below Canada’s (Figure 19).
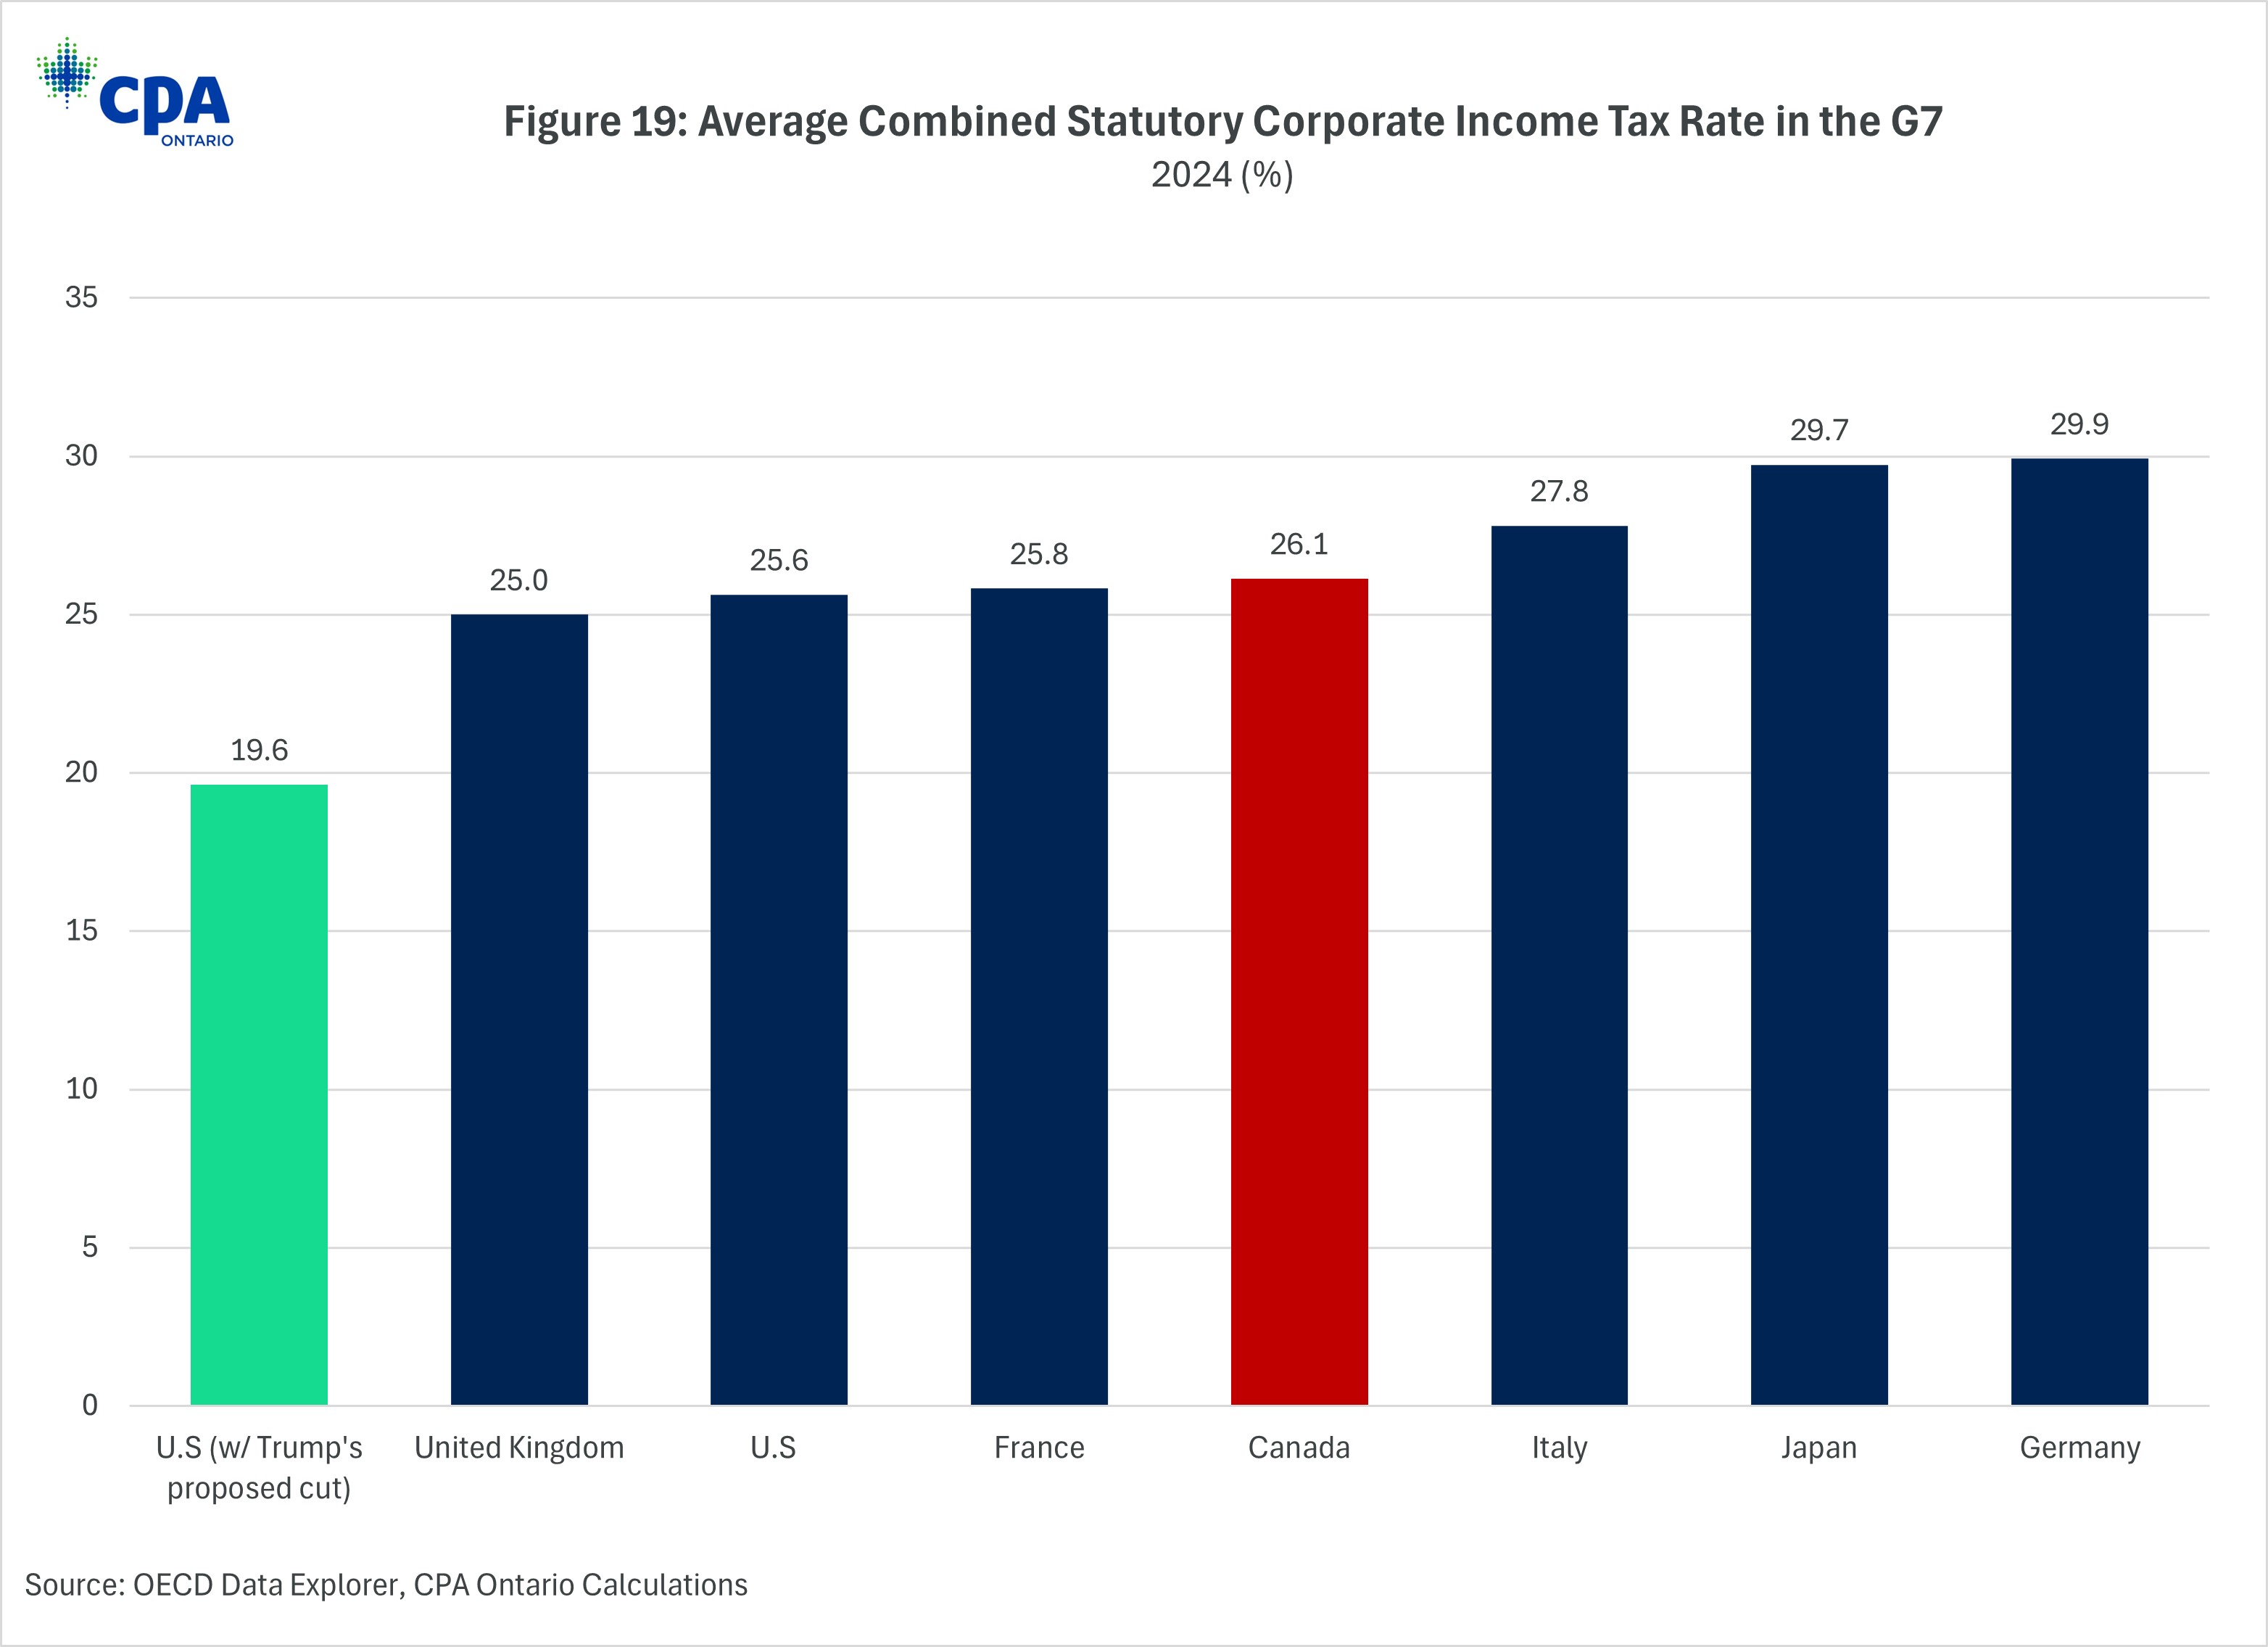
Figure 19: Average Combined Statutory Corporate Income Tax Rate in the G7
President Trump’s deregulation policies are aimed at reducing the compliance burden on businesses, making it easier for companies to operate, innovate, and expand. With global capital scarce and mobile, these policies stand to attract more investment to the U.S., increasing production efficiency and creating jobs.
This would be a significant competitive advantage for the U.S.—particularly at a time when Canada’s economic competitiveness is vulnerable and has eroded due to a series of policy changes over the past decade.
Canada’s capacity to attract investment is measured against the U.S., and our proximity to the American market has historically been one of our key competitive advantages. Tariffs, combined with the U.S. administration’s deregulation campaign and tax cuts, would significantly undermine these advantages.
Canada can no longer afford to wait. Eighty-eight percent (88%) of CPAs surveyed by CPA Ontario agreed that reforming the personal and corporate tax system is important. If Canada hopes to enhance its competitiveness even in the face of these challenging policy changes, bold action is required now.
Canada Needs a Prosperity-Focused Policy Agenda
There is real momentum in Canada right now that must be capitalized on. While uncertainty looms large, this is when decisive action matters most.
Canada has the tools to succeed. With a well-educated workforce, world-class sectors, and abundant natural resources, the foundations for economic renewal are already in place. However, unlocking this potential requires a concerted effort to strengthen competitiveness and create an environment where economic activity can thrive. The time for incrementalism has passed—Canada and Ontario must now adopt a prosperity-focused policy agenda that fosters innovation, attracts capital, and empowers businesses to drive growth.
A renewed commitment to productivity-enhancing investments, competitive tax policies, and innovation-driven strategies will help Ontario and Canada not only close the widening gap with the U.S. but also create a more dynamic and prosperous future.
Next Steps
President Trump’s tariffs have led to a groundswell of patriotic fervour in Canada, as well as recognition that the status quo is simply no longer an option. There is a broad-based consensus that Canada’s anemic economic performance and dependency on the U.S. has left us vulnerable, and that needs to change.
While the tariffs may have been the tipping point, Ontario and Canada’s challenges are deep and longstanding. Building a more productive, more competitive, and ultimately more resilient Canada will require bold and decisive action. It will require leaders across all sectors to come together and offer their best solutions, and their boldest ideas.
Ontario is home to over 100,000 CPAs, many of whom are operating at the highest levels of global business. Many have already begun offering their points of view on how Canadian businesses can respond to this era of uncertainty. As trusted advisors, CPAs bring expertise in regulatory compliance, audit and tax policy, and supply chain management. They offer a unique perspective on reversing these economic trends and building a nation that matches the ambitions and aspirations of its people.
Through our Trade and Growth Insights initiative, CPA Ontario will be gathering the perspectives of leading CPAs across the province, along with the views of industry groups and subject matter experts with the goal of bringing forward a series of public policy proposals.
Focused on areas where CPAs have unique insights, including reforming the tax code, Canada’s regulatory regime and the innovation economy, these proposals will present real, tangible ways that Canada can build a stronger, more competitive economy.
Canada is at an inflection point, and now is the time to act.
[1] Academic research shows that high levels of policy uncertainty are empirically associated with reduced economic performance. See, among others, Scott R. Baker, Nicholas Bloom, and Steven J. Davis, "Measuring Economic Policy Uncertainty," National Bureau of Economic Research, 2015, https://www.nber.org/papers/w21633.
[2] The year 2010 is used as the base year for many of the comparisons. The reason is that with most data series ending in 2023 or 2024, a standard 10-year comparison would be against 2014 and 2015 when the commodity supercycle ends, and major parts of the Canadian economy experience severe contractions. Thus, comparisons between these years could give an artificial view of growth given the low starting point. We thus use 2010 as a base to track key trends in several economic indicators.
[3] This refers to the acquisition of produced assets (including purchases of second-hand assets), including the production of such assets by producers for their own use, minus disposals.
[4] Residential capital in Canada has three component parts: new residential construction, renovations, and ownership transfers.